Admissions
Click on a dashboard icon to view
![]() Access Required
Access Required ![]() Public
Public
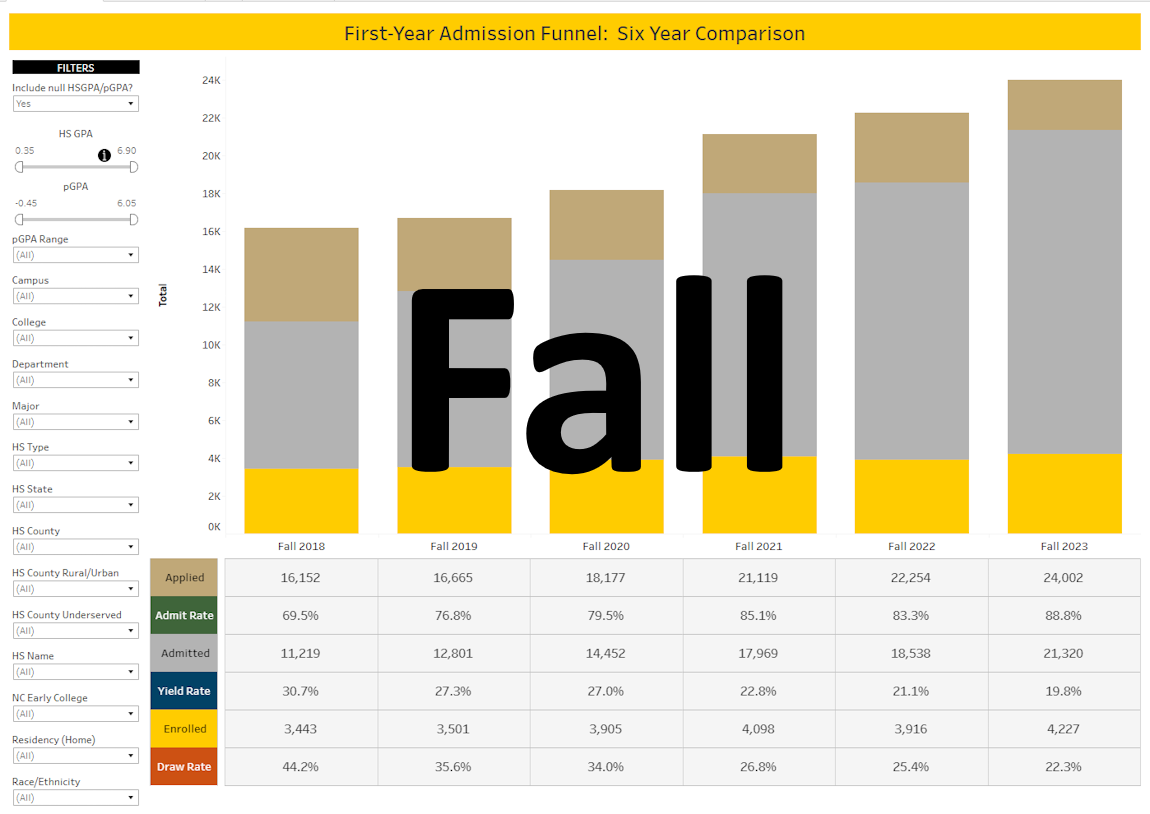
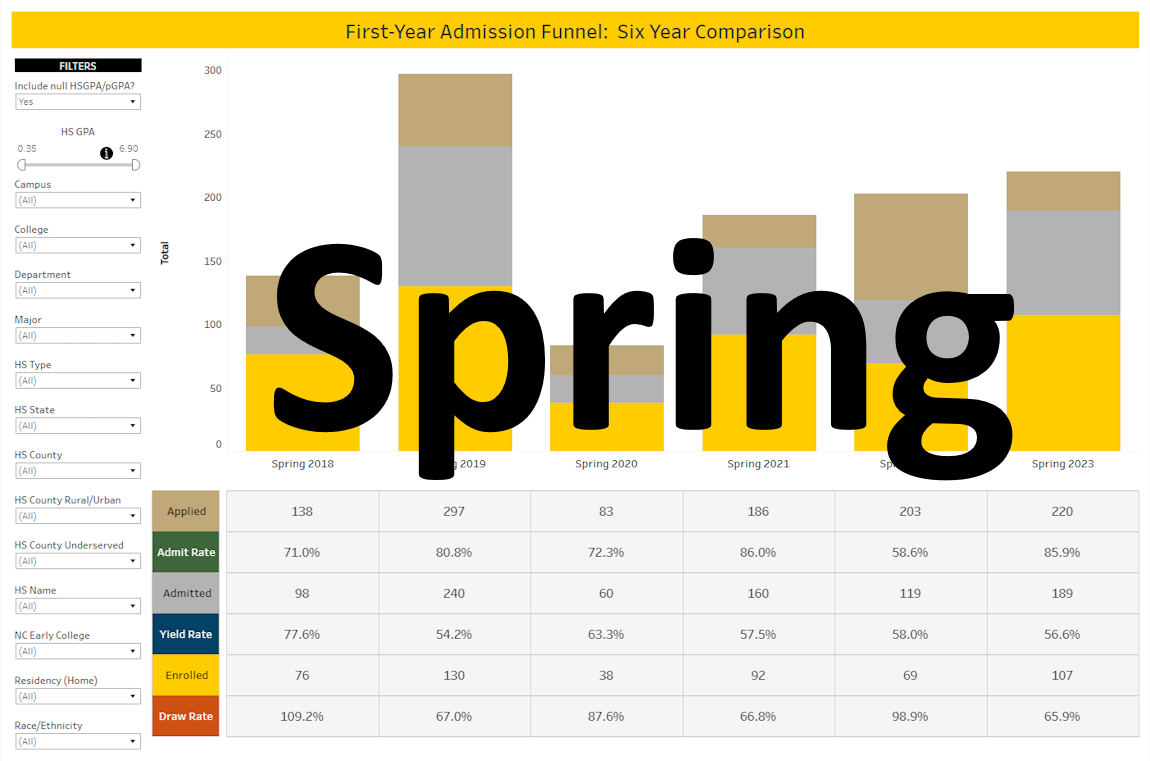
First Year Admissions Funnel
This dashboard shows a multi-year comparison of the admissions funnel. Applied, admitted and enrolled students can be filtered by their demographic attributes.
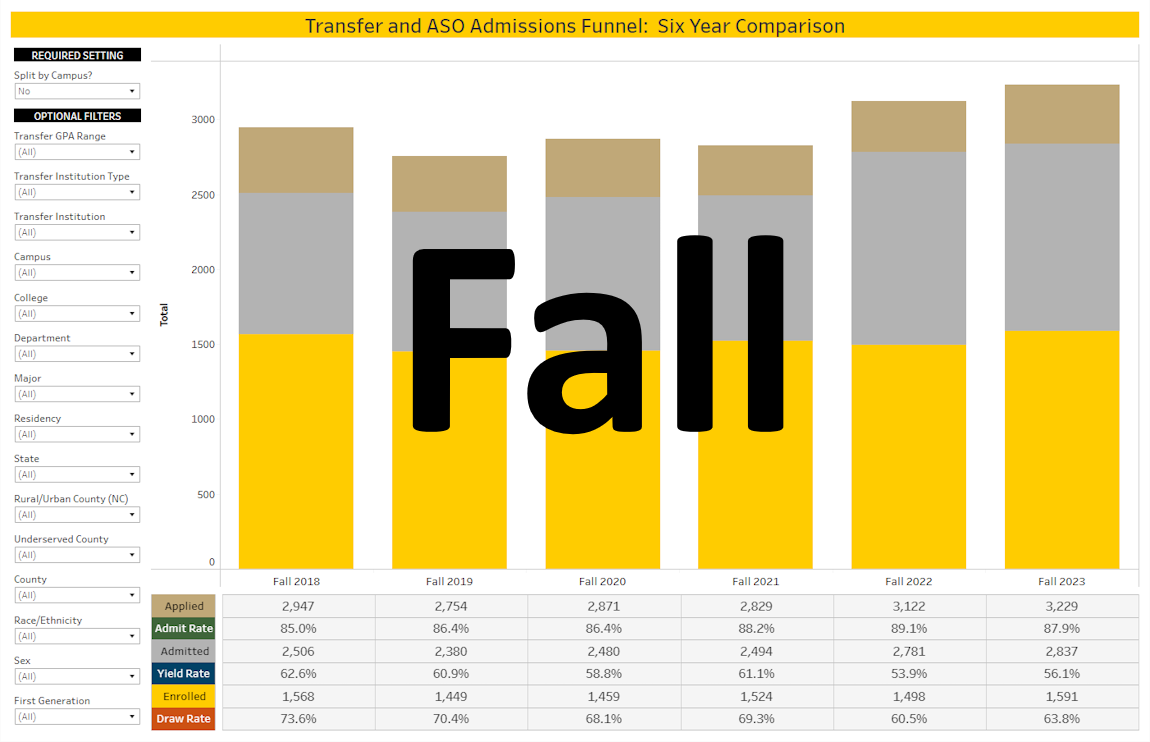
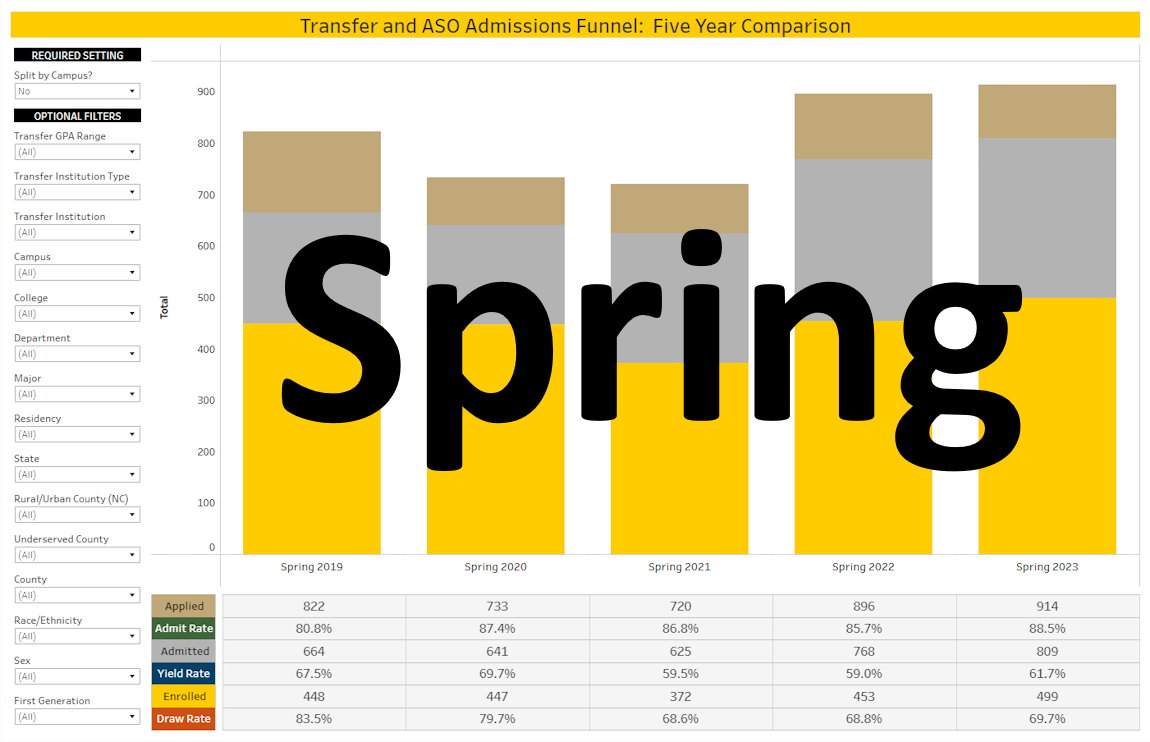
Transfer Admissions Funnel
This dashboard shows a multi-year comparison of the transfer student admissions funnel. Applied, admitted, and enrolled students can be filtered by their demographic attributes.
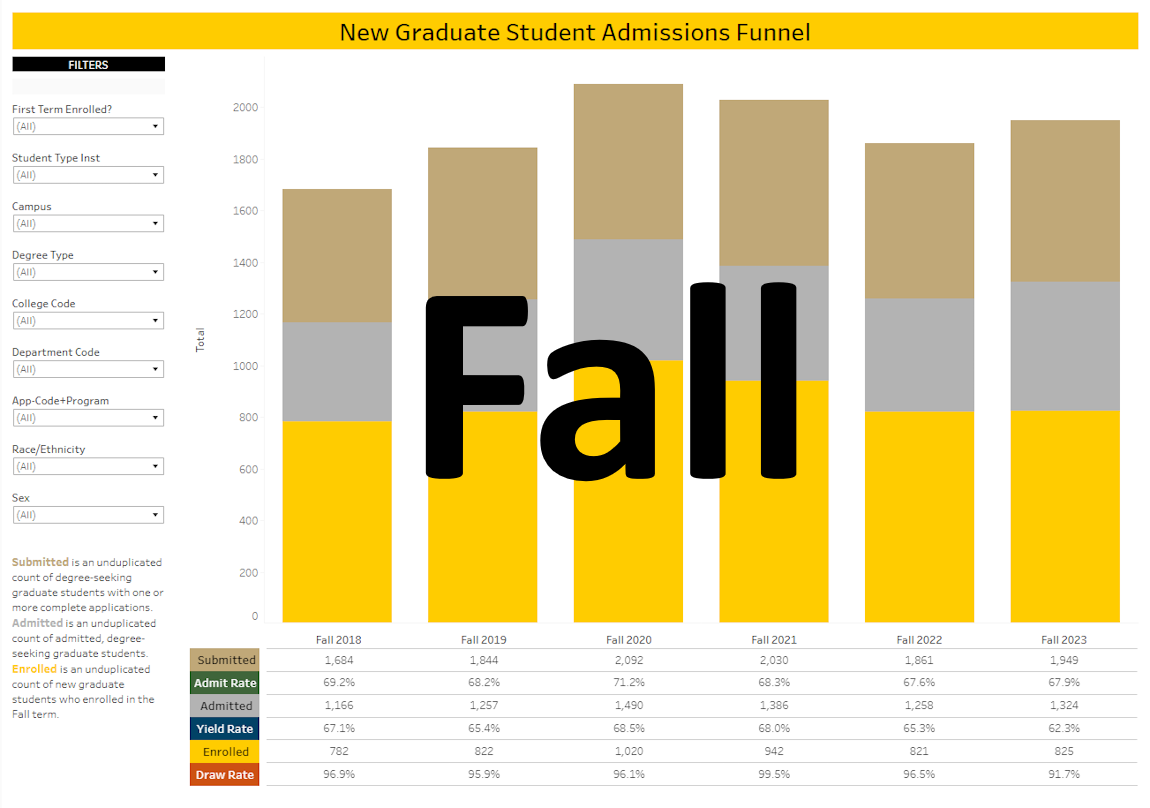
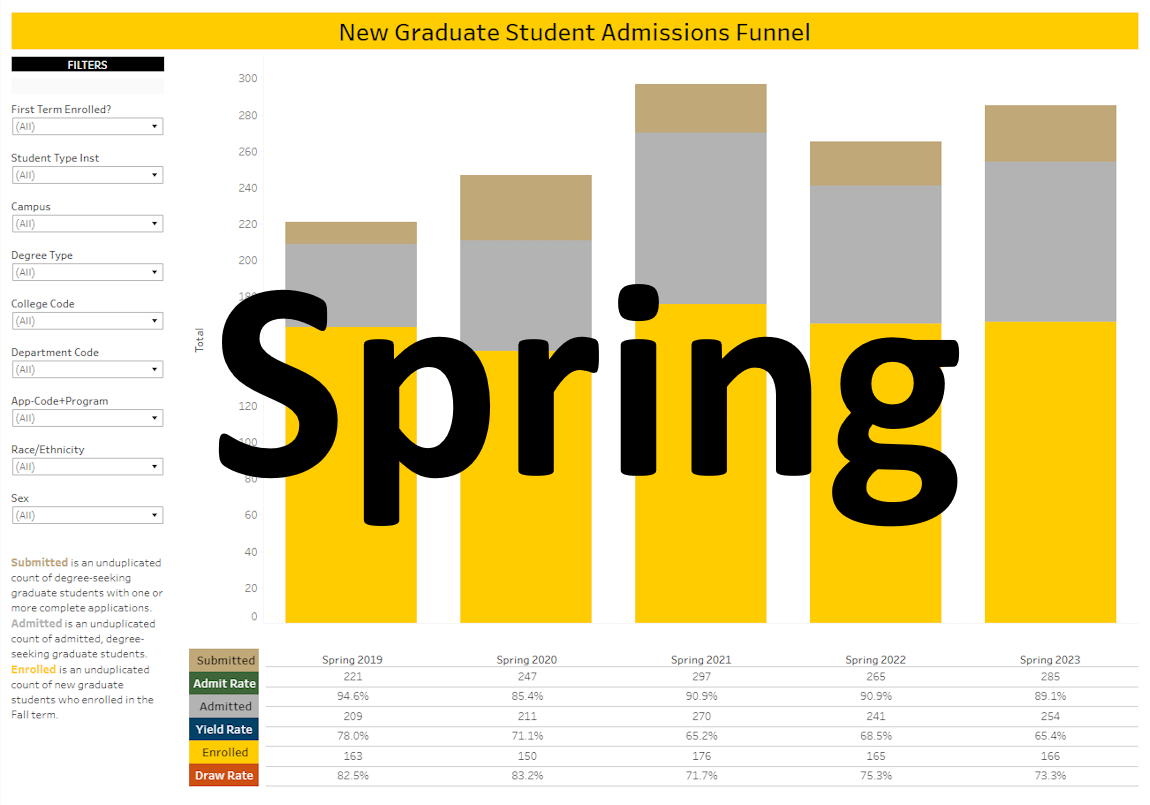
New Graduate Student Admissions Funnel
These dashboards show a multi-year comparison of the new graduate student admissions funnel both aggregated and at the program level. Submitted, Admitted, and Enrolled students can be filtered by their demographic attributes.
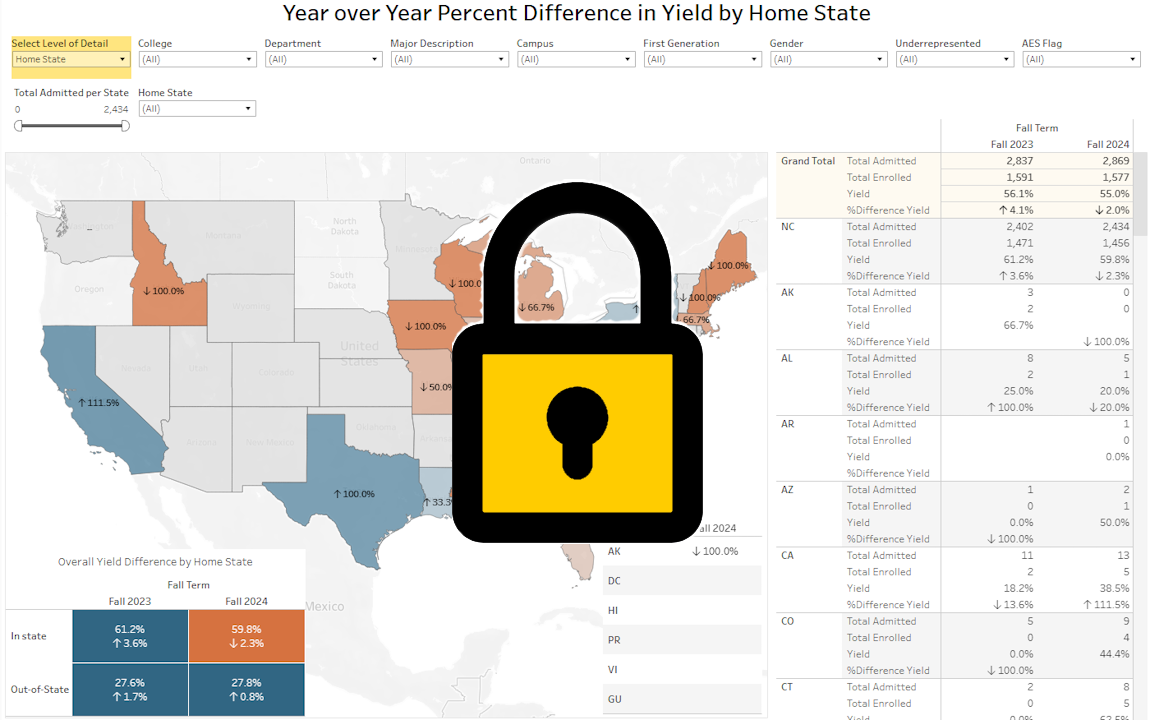
2023-2024 First Year Yield Geography
This dashboard provides a collection of maps showing New First-Year Yield at the State, County, Geomarket, and High School levels.

2023-2024 New Transfer Yield Geography
This dashboard provides a collection of maps showing New Transfer Yield at the State, County, and Geomarket levels.
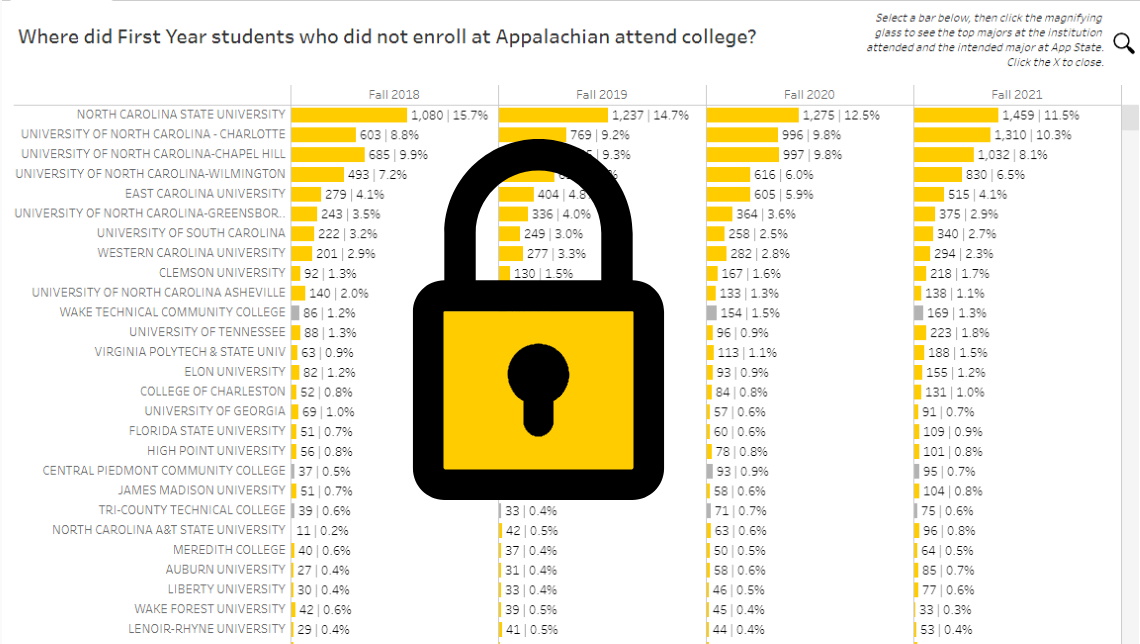
Other Colleges Attended - Undergraduate Applicants
This dashboard shows a three-year history of where new first-year and new transfer students enrolled who were admitted to Appalachian State but subsequently attended another institution of higher education. The National Student Clearinghouse provides subsequent enrollment data.
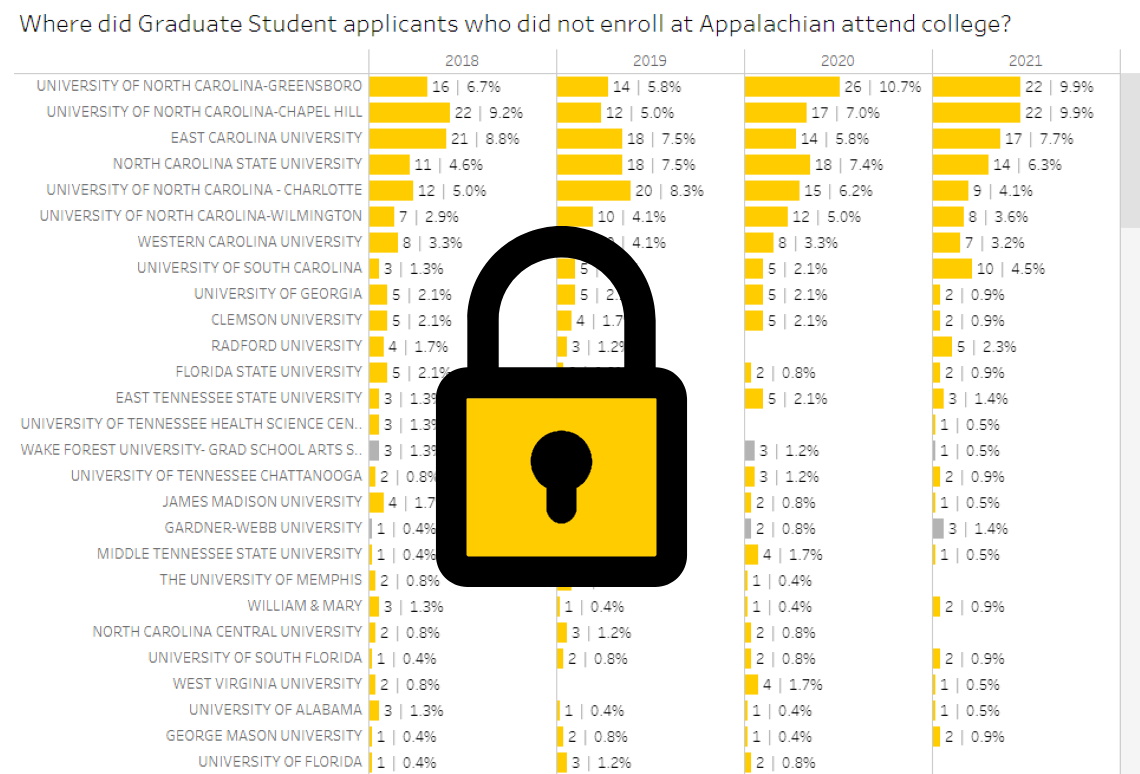
Other Colleges Attended - Graduate Applicants
This dashboard shows a four-year history of where graduate applicants enrolled who were admitted to Appalachian State but subsequently attended another institution of higher education. The National Student Clearinghouse provides subsequent enrollment data.
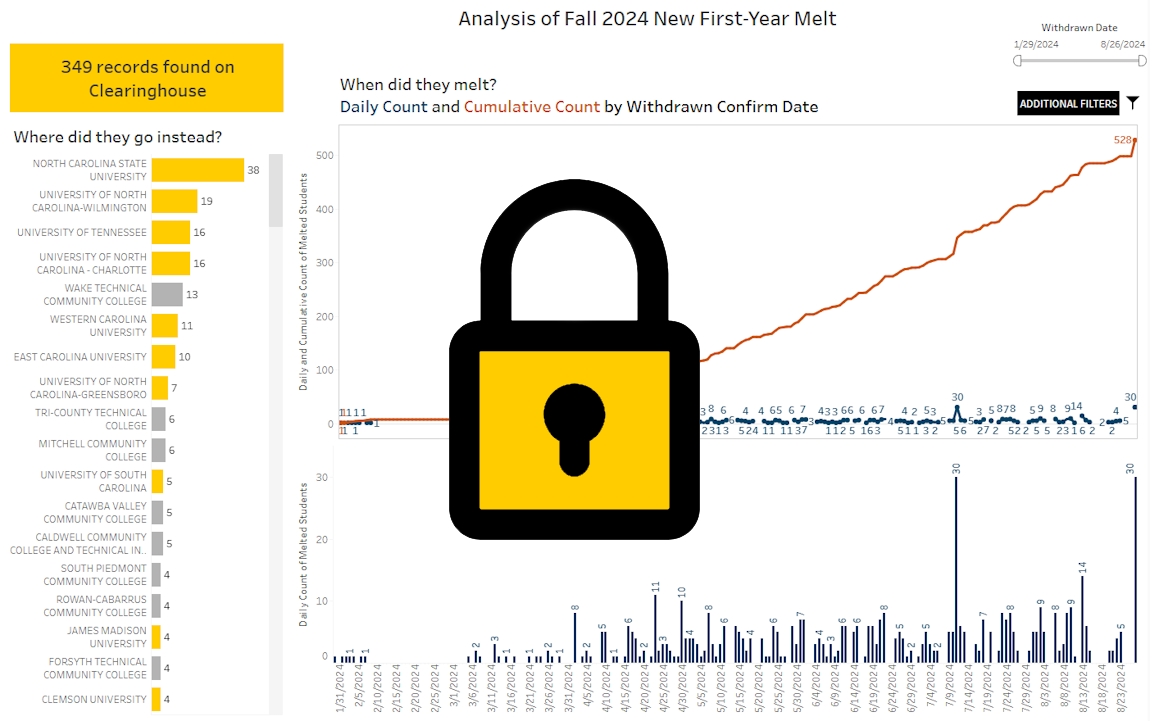
Fall 2024 New First-Year Melt Analysis
This dashboard shows daily and cumulative counts of New First-Year students that melted in Fall 2024. Other institutions attended are provided for those with National Student Clearinghouse records.
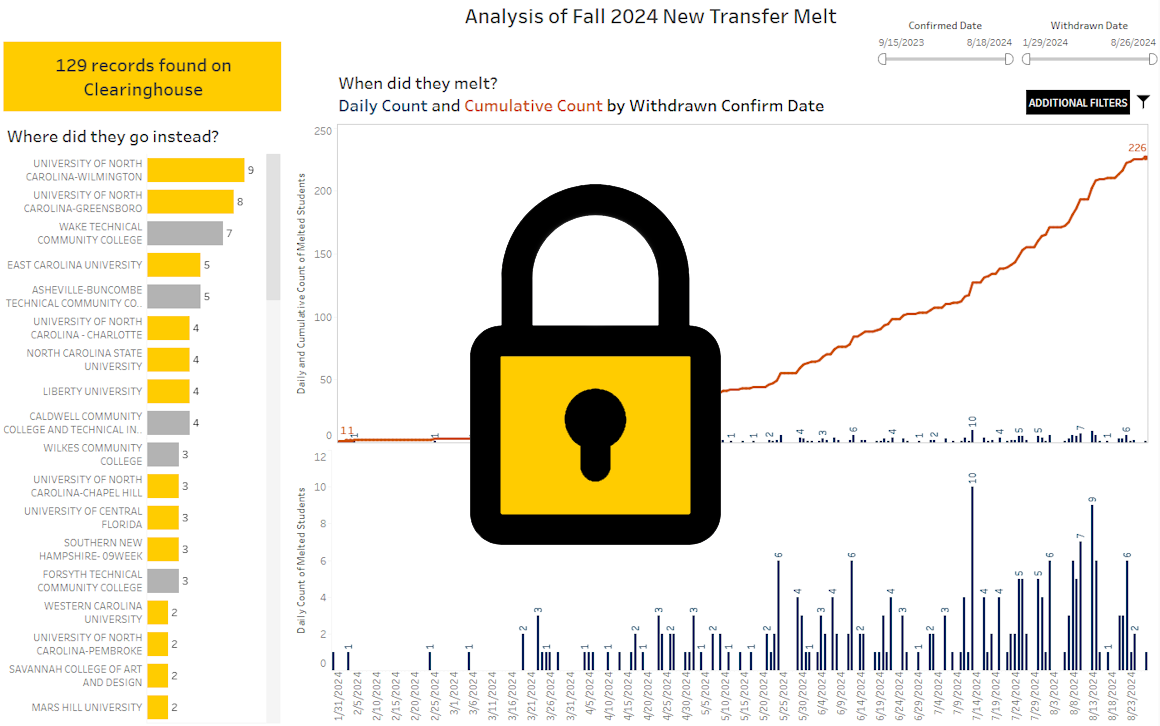
Fall 2024 New Transfer Melt Analysis
This dashboard shows daily and cumulative counts of New Transfer students that melted in Fall 2024. Other institutions attended are provided for those with National Student Clearinghouse records.
|
Need some help? Learn how to navigate and engage with AppAnalytics by viewing the quick reference guide. |