Student Success
Click on a dashboard icon to view
New First-Year Students
A multi-year view of new first-year student enrollment by college, department and major, including details by academic and demographic attributes, in addition to pre-college academic measures and university outcome measures.


New Transfer Students
A multi-year view of new transfer student enrollment by college, department and major, including details by academic and demographic attributes, in addition to transferring academic measures and university outcome measures.


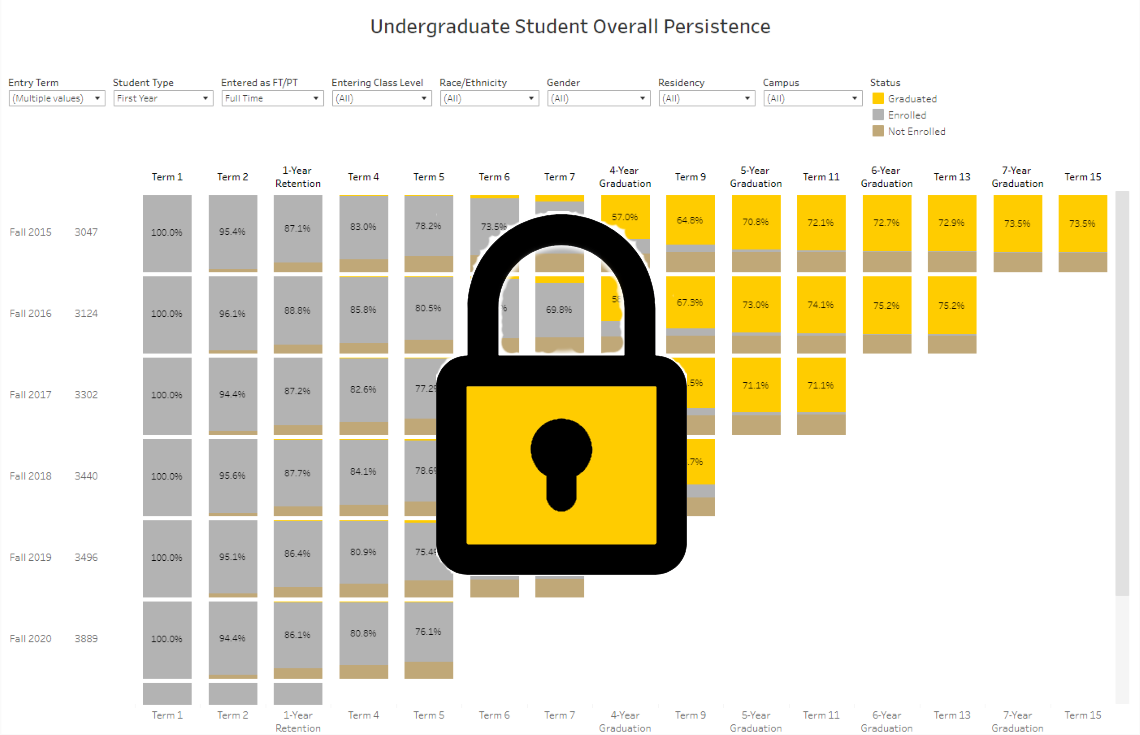
Persistence and Graduation
Detailed year-by-year persistence and graduation rates for new first-year and new transfers by gender, ethnicity, residency status and entering college.


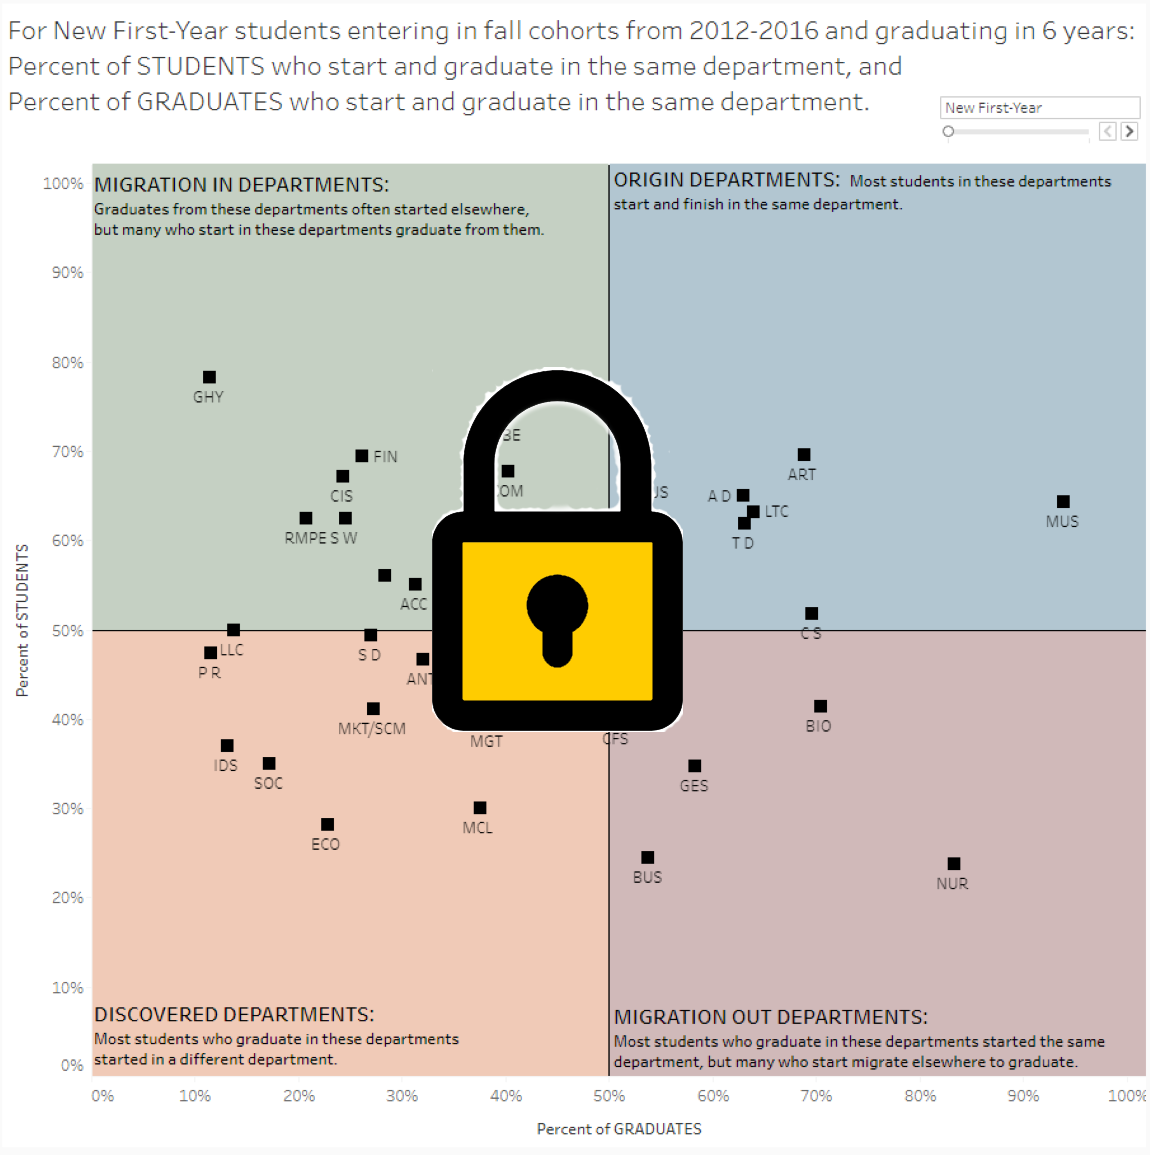
Department Quadrant Analysis of Undergraduate Degree-Earners - Entering and Final Department
This dashboard shows the percentage of new students earning a degree in their entering department and the percentage of this population for all degree-earners in the same department. This dashboard highlighted which departments have significant in/out-migration and those that do not.
Undergraduate Persistence and Forward Migration by Entering Area
This dashboard details the persistence (retention and gradation) for entering new undergraduate students. It details the college, department, or program of students in their entry term and shows the number and percent subsequently earning a degree within that respective unit/program, and if not, the academic unit/program in which a student did earn a degree.
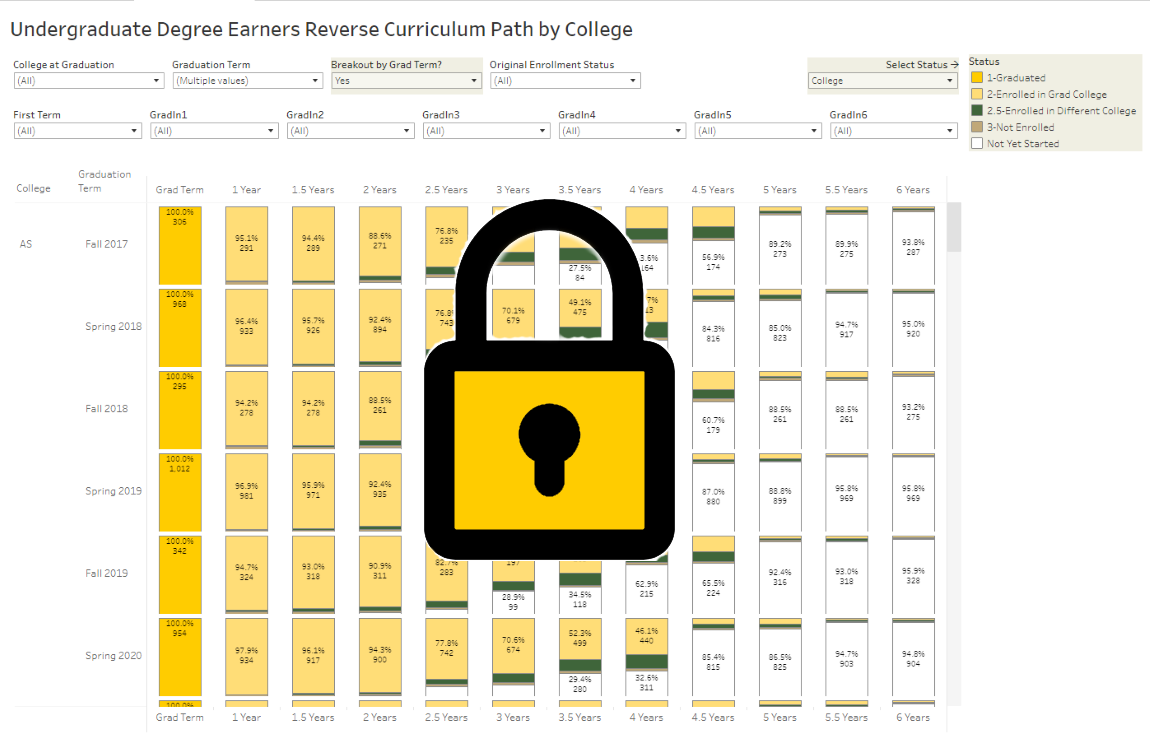
Undergraduate Degree-Earners Reverse Curriculum Path
This dashboard tracks undergraduate degree earners from graduation backward through their respective previous term enrollments by college, department and major. This dashboard shows the students' migration to the degree-earning academic area.
Credit Accumulation
For students enrolled in a fall term with fewer than 90 credits, this dashboard shows the average number of credits attempted and earned in each term for the associated academic year. A downloadable roster is included.

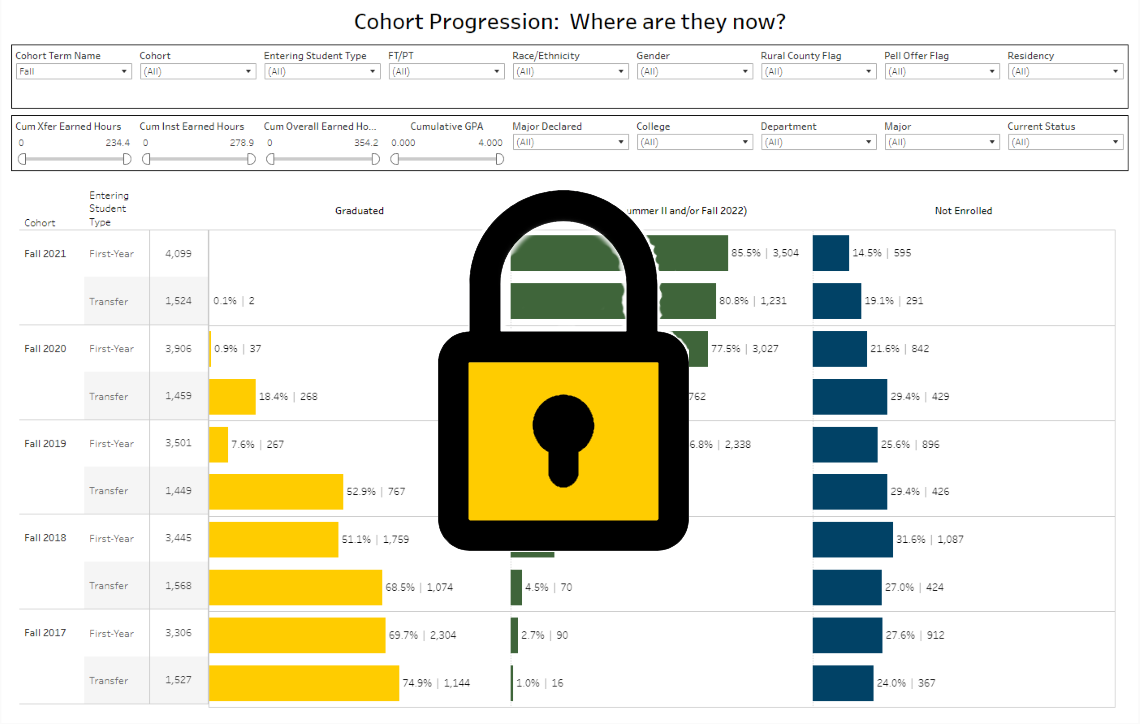
Undergraduate Cohort Progression
The Cohort Progression Dashboard looks at New First-Year and New Transfer students who started in the fall and spring semesters from fall 2017 to the present to determine their current status.
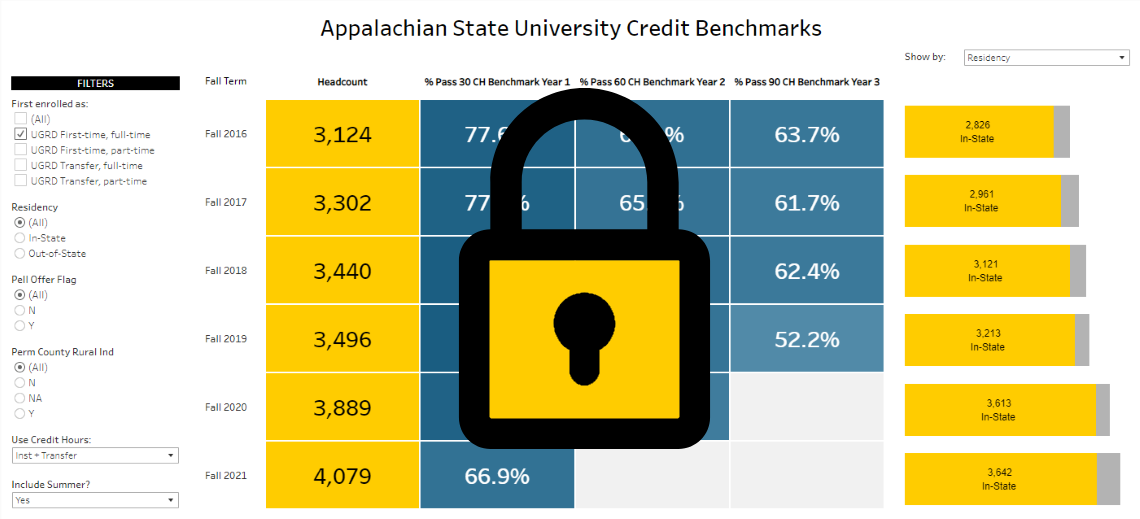
Undergraduate New Cohort Credit Benchmarks
Tracking entering new undergraduate cohorts reaching credit hour amounts (>=30 after year 1, >=60 after year 2, >=90 after year 3).
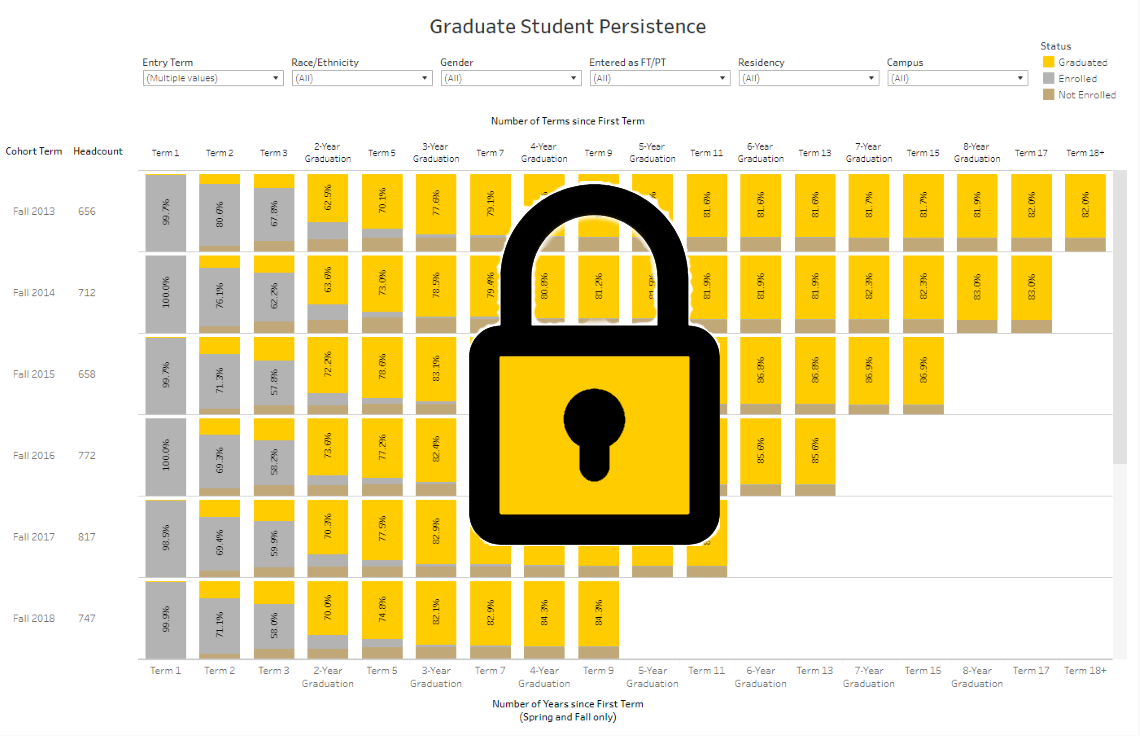
Graduate Student Persistence Overall and by Program
This dashboard details new graduate student persistence (retention and graduation) by their entering term and program (beginning on tab 3). This is a persistence and graduation rate by program and only includes students who persisted and/or graduated in the same program they began.
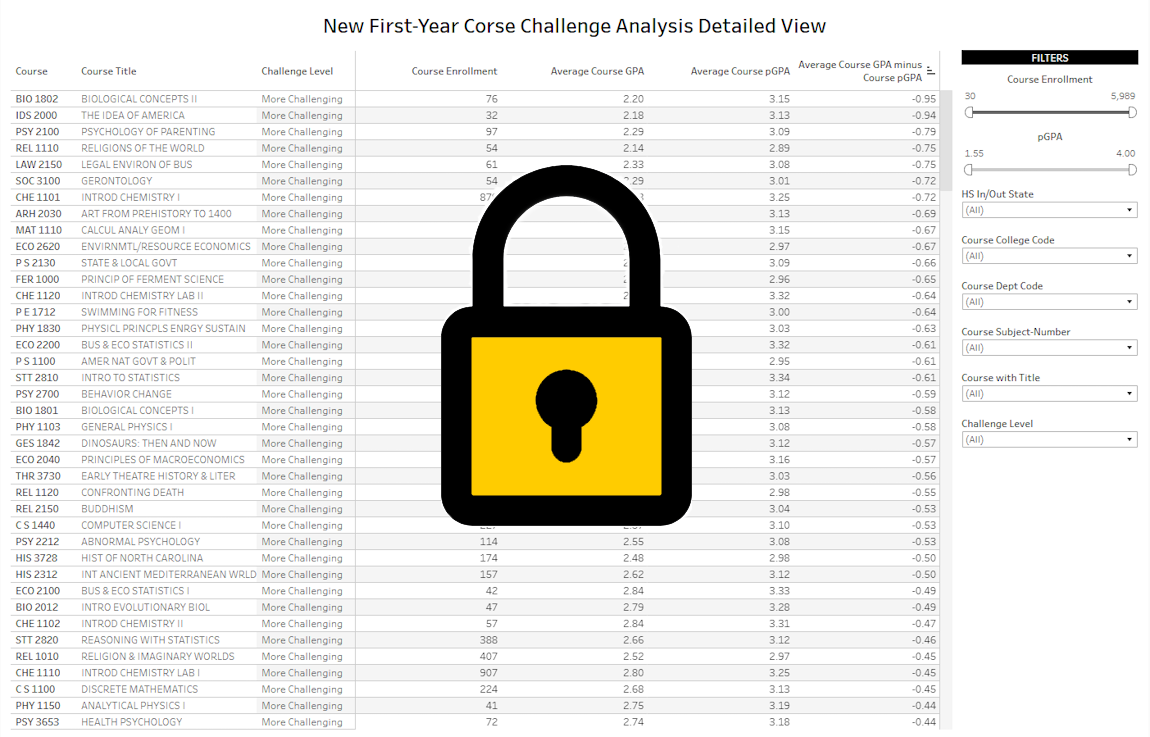
New First-Year Course Challenge Analysis
This dashboard compares average student pGPAs to average course GPAs in order to determine how challenging courses are for new first-year students..
Grade Summary, Distribution and DFW/Pass Rates
This dashboard shows average course GPA and grade distributions calculated per term as well as Pass/DFW rates for individual courses. Filters include course attributes as well as student attributes.

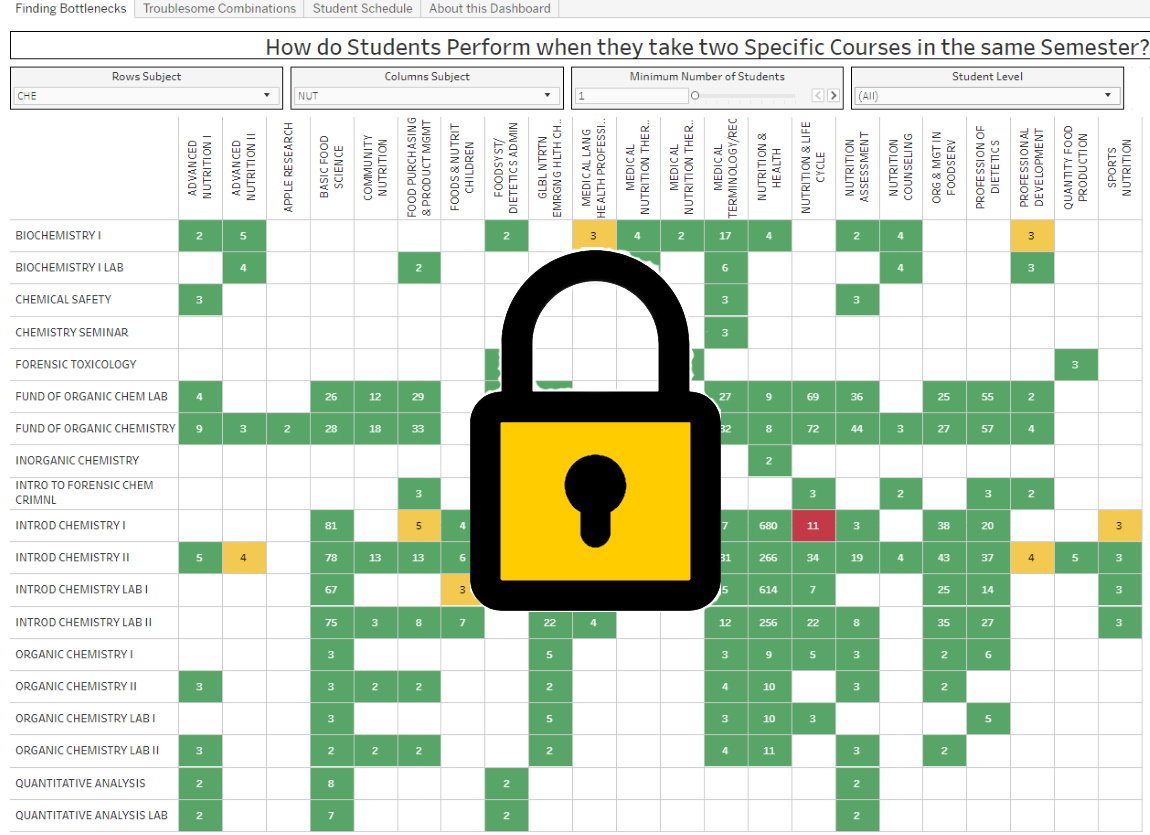
Co-Enrollment Performance
How students perform when they take two specific courses in the same semester.
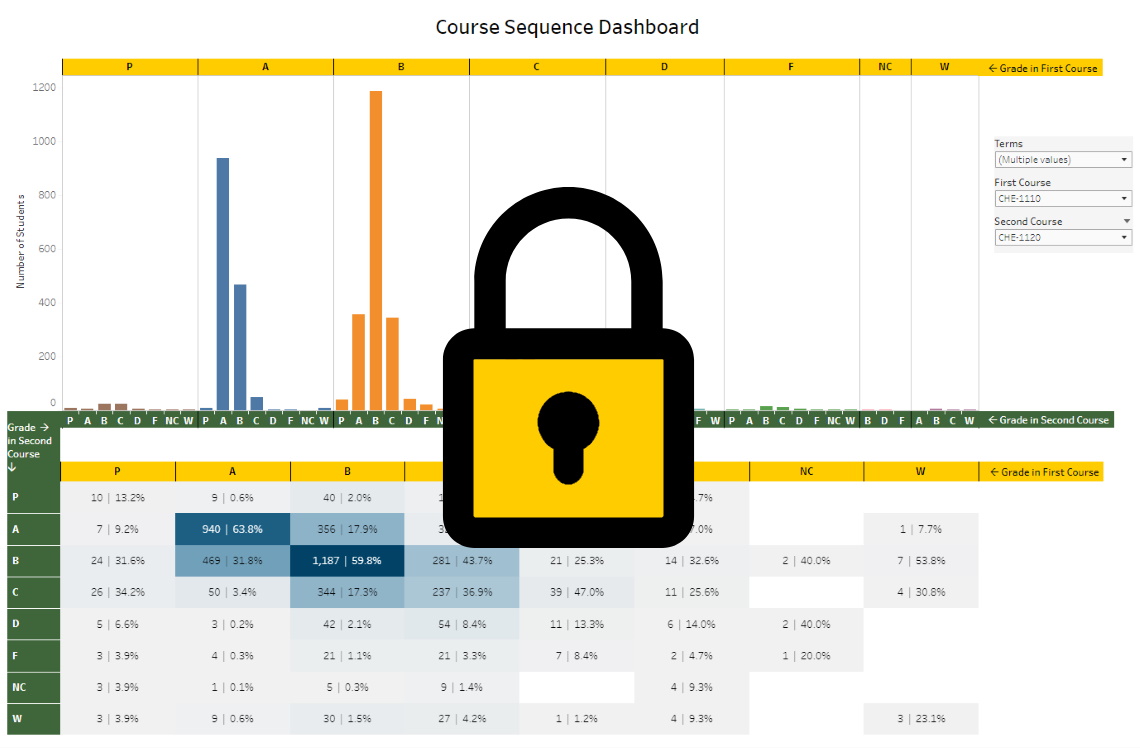
Grade Distribution by Course Sequence
Grade distributions by course sequence, comparing grades in a course to grades in the following course.
|
Need some help? Learn how to navigate and engage with AppAnalytics by viewing the quick reference guide. |