Deans and Chairs
Click on a dashboard icon to view
![]() Access Required
Access Required ![]() Public
Public
Alumni Pathways
Explore Alumni employment outcome data produced through a partnership between App State and Lightcast.

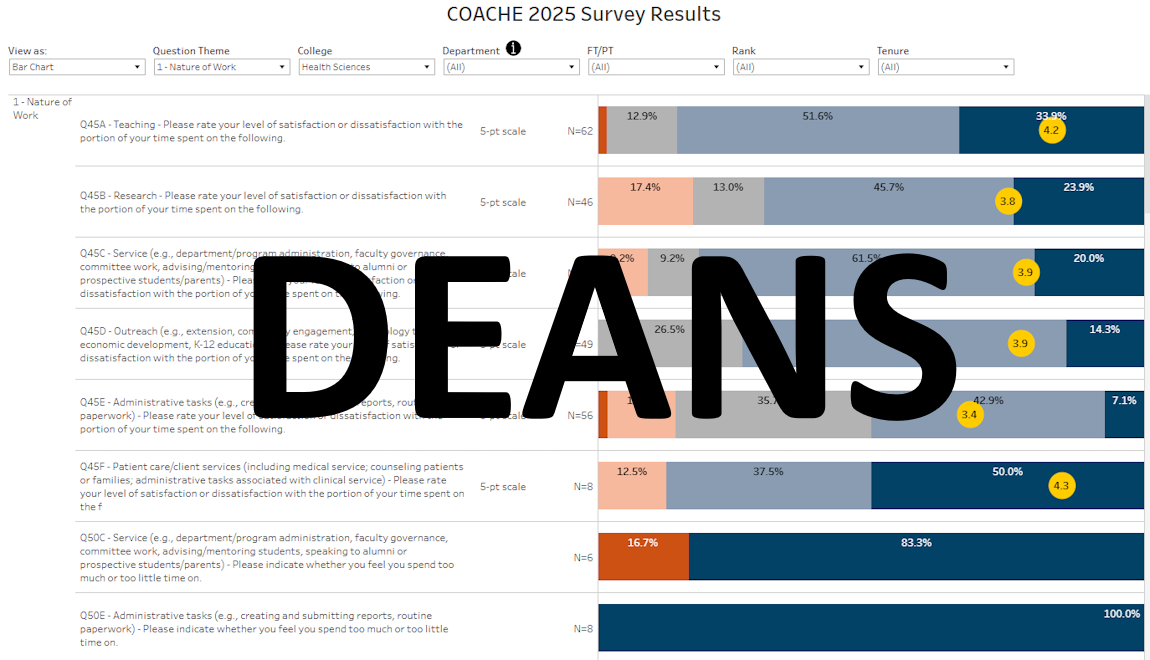
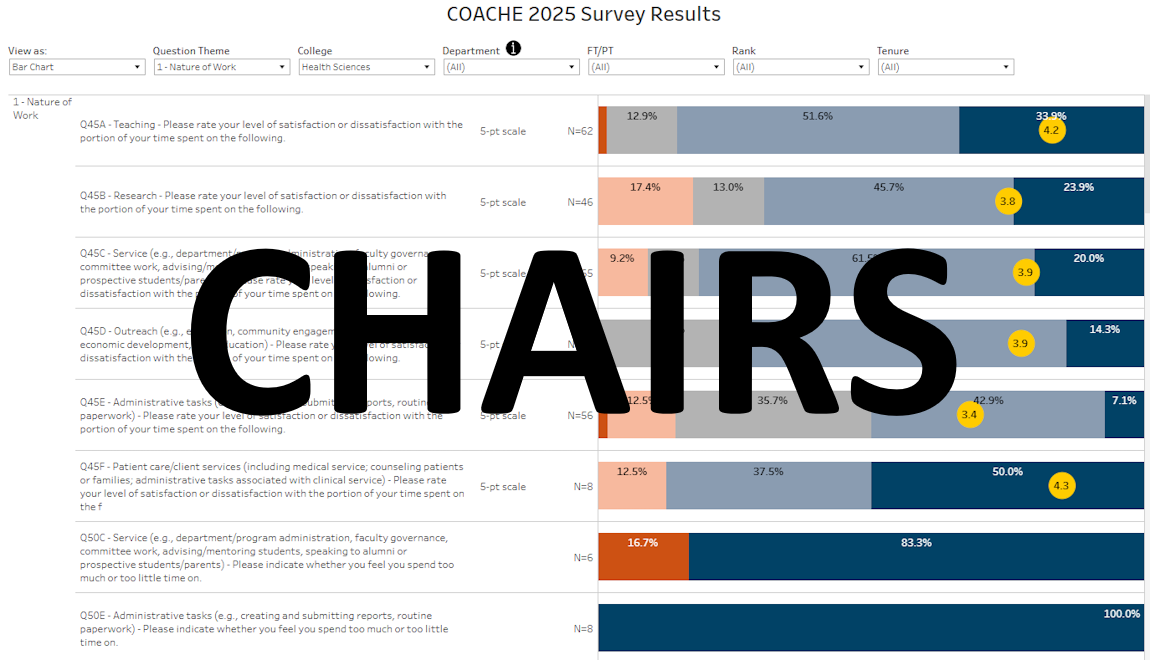
COACHE 2025
These dashboards show the results of the 2025 COACHE Survey and are filtered to the college level for deans or chairs.
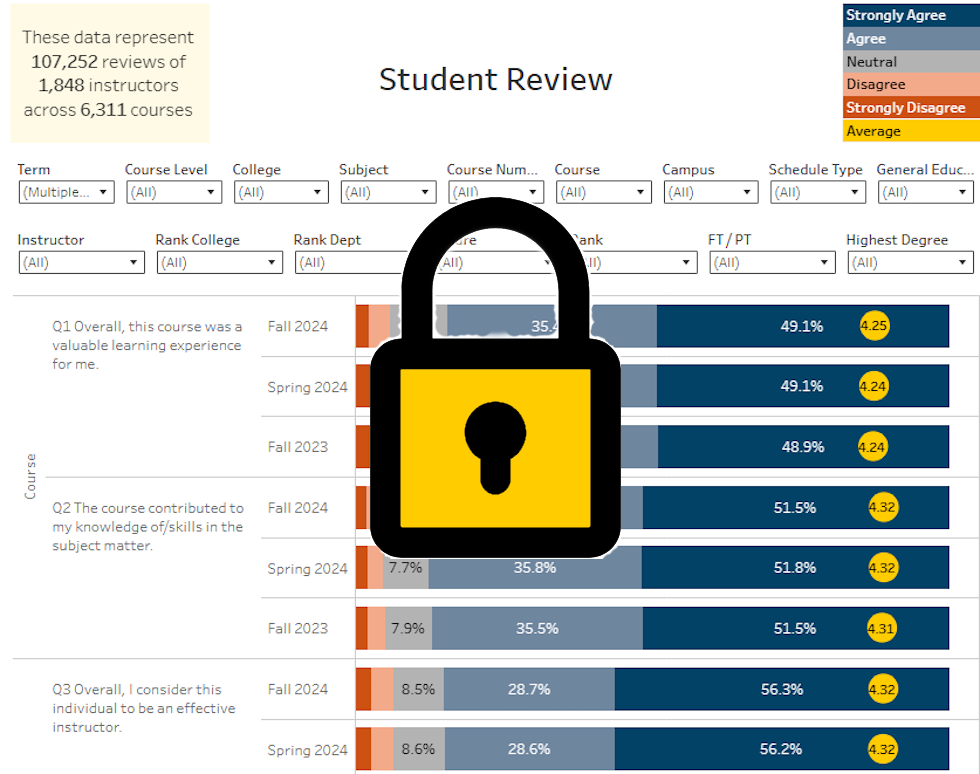
Student Review
This dashboard shows the longitudinal and aggregate results of student reviews (course evaluations) at the instructor and course level with response rates by department. Click here to view an instructional video for this dashboard.
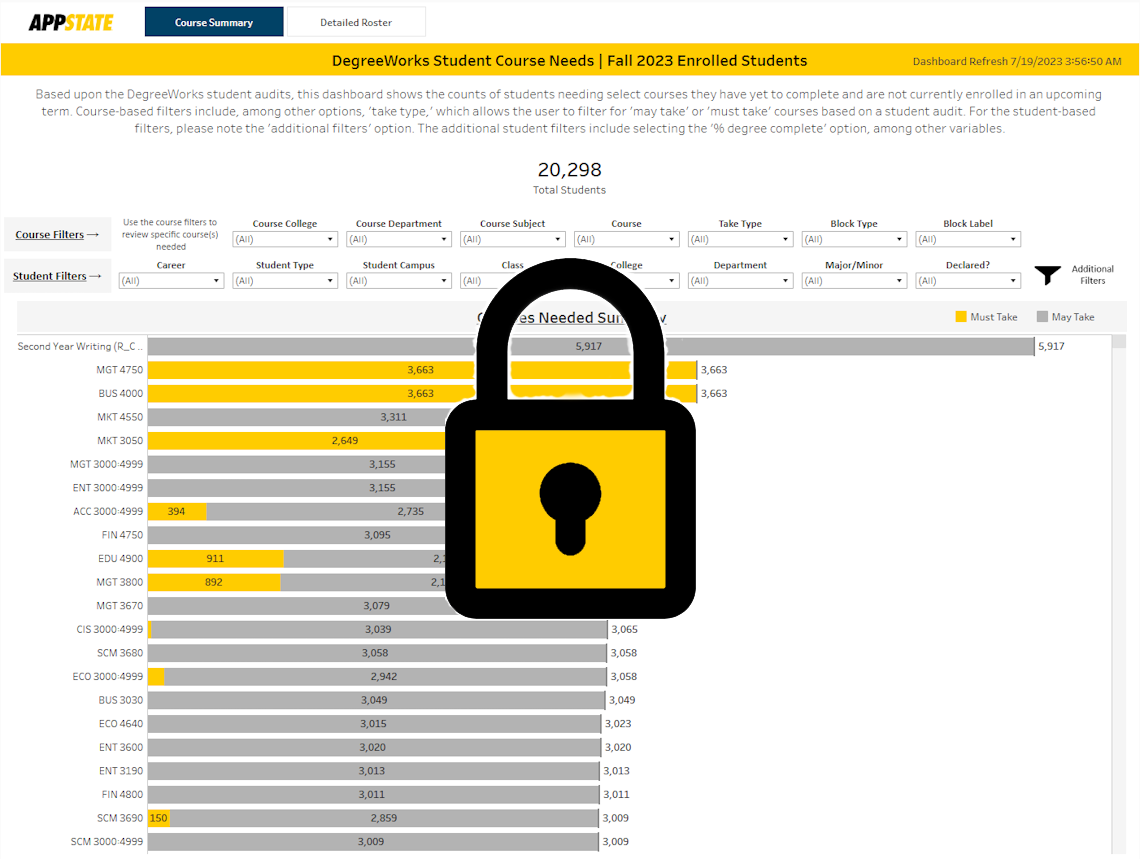
DegreeWorks Student Planning
This dashboard uses the data from a student's most recent curriculum audit to allow the user to apply multiple student and course-level filters to identify future course needs. This dashboard includes future need courses including controlling for courses in-progress and transfer credit.
Current Faculty
Current faculty by college, department, rank, and other attributes including faculty senate voting eligibility.
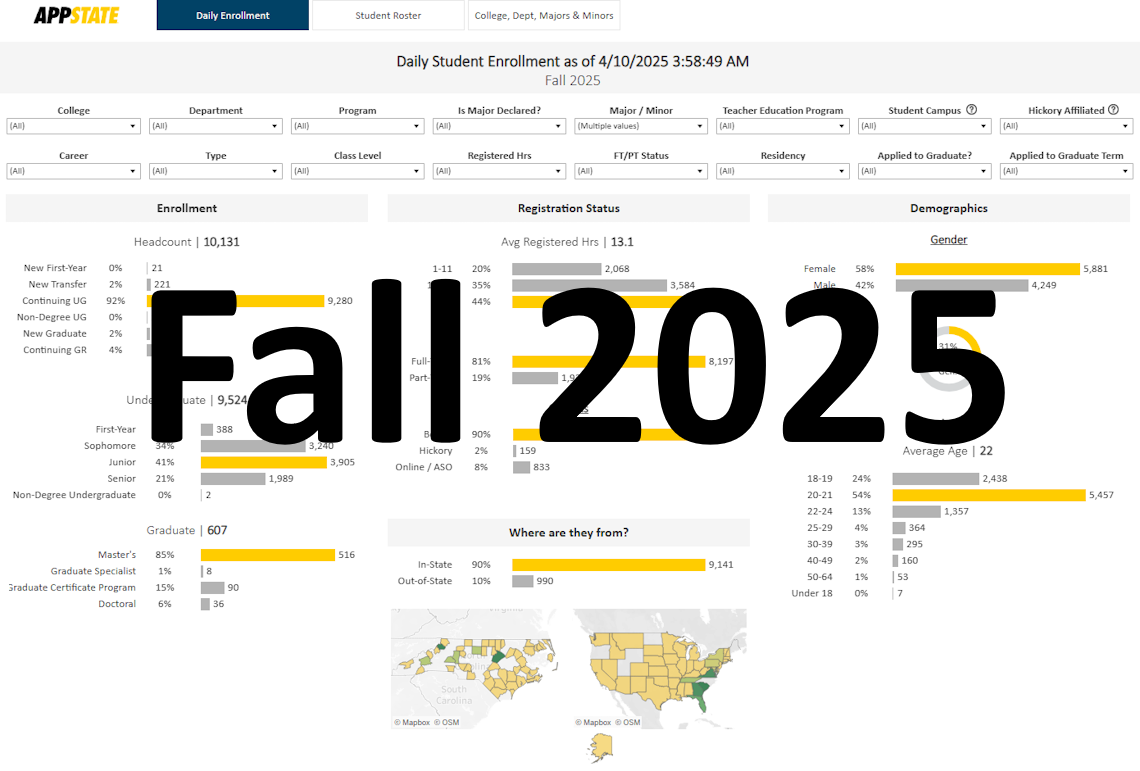
Daily Enrollment Summary
A daily enrollment summary, including academic and demographic details.

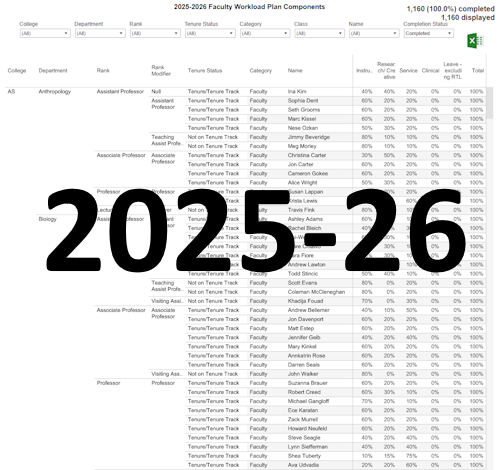
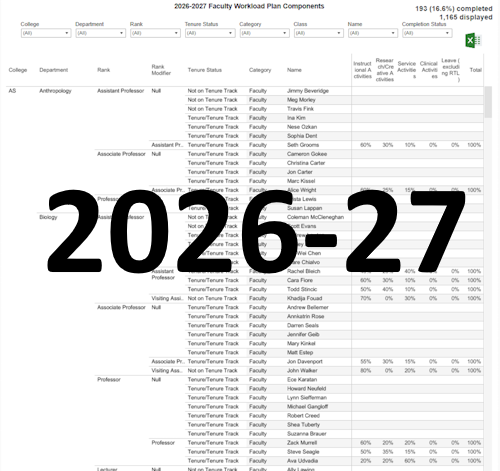
Faculty Workload Plan Components
Faculty workload components by faculty member.
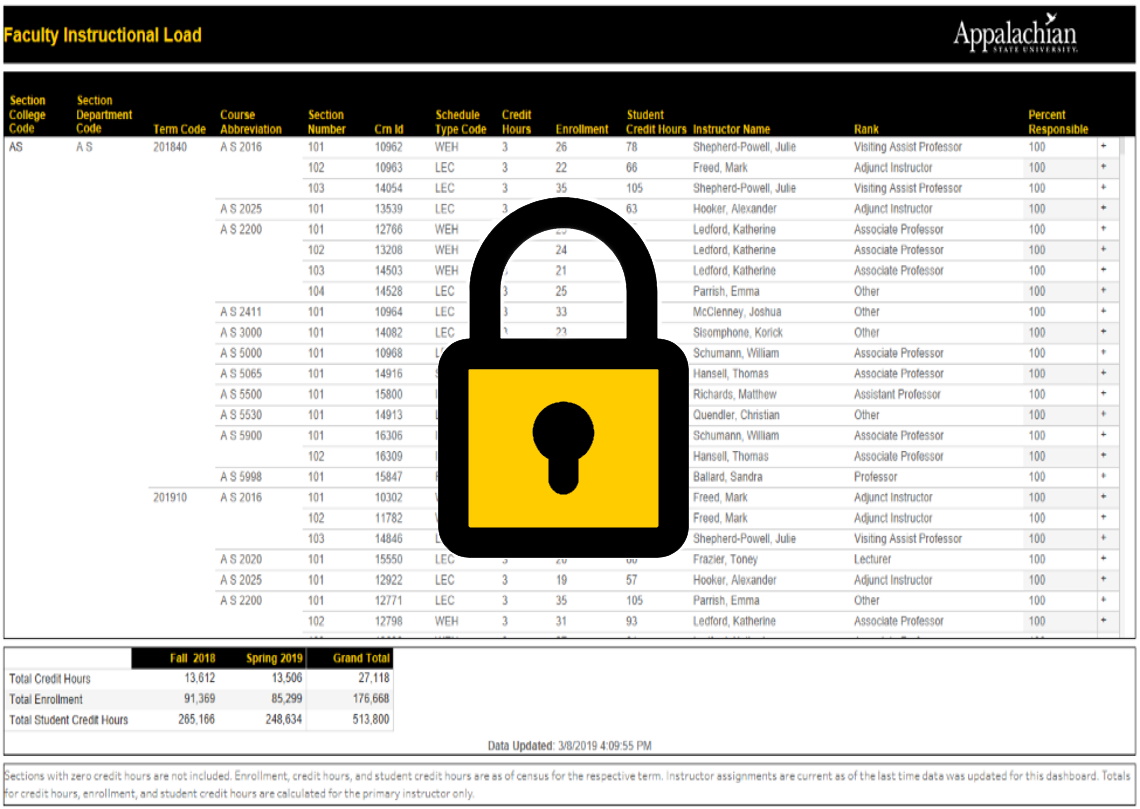
Faculty Instructional Load
Faculty instructional load by instructor, college and department.
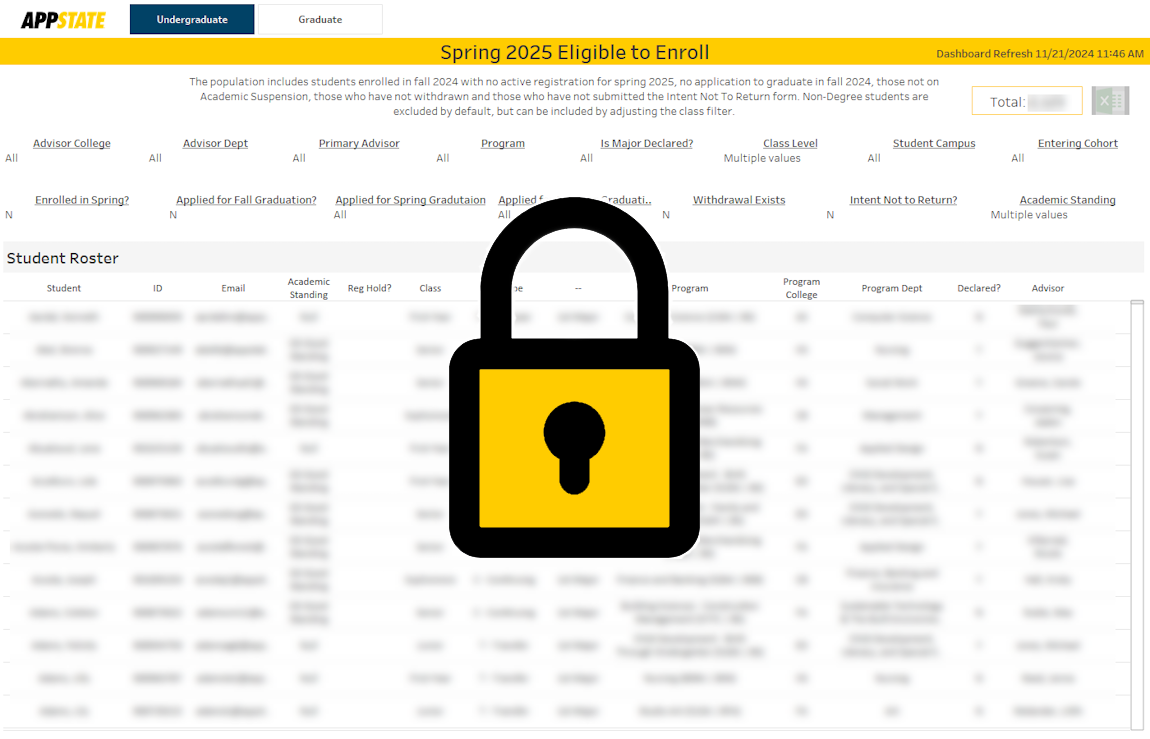
Eligible to Enroll
A detailed view of students who are eligible to enroll for a future term
Grade Summary, Distribution and DFW/Pass Rates
This dashboard shows average course GPA and grade distributions calculated per term as well as Pass/DFW rates for individual courses. Filters include course attributes as well as student attributes.

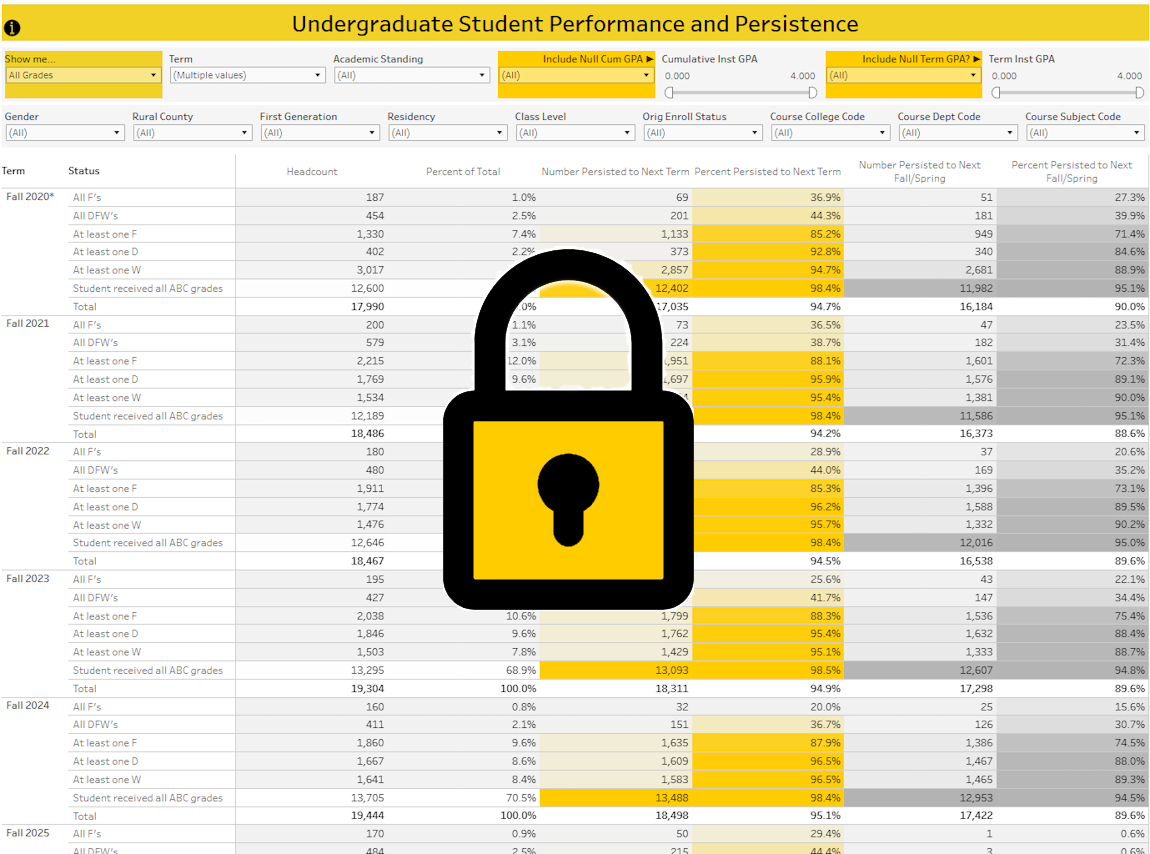
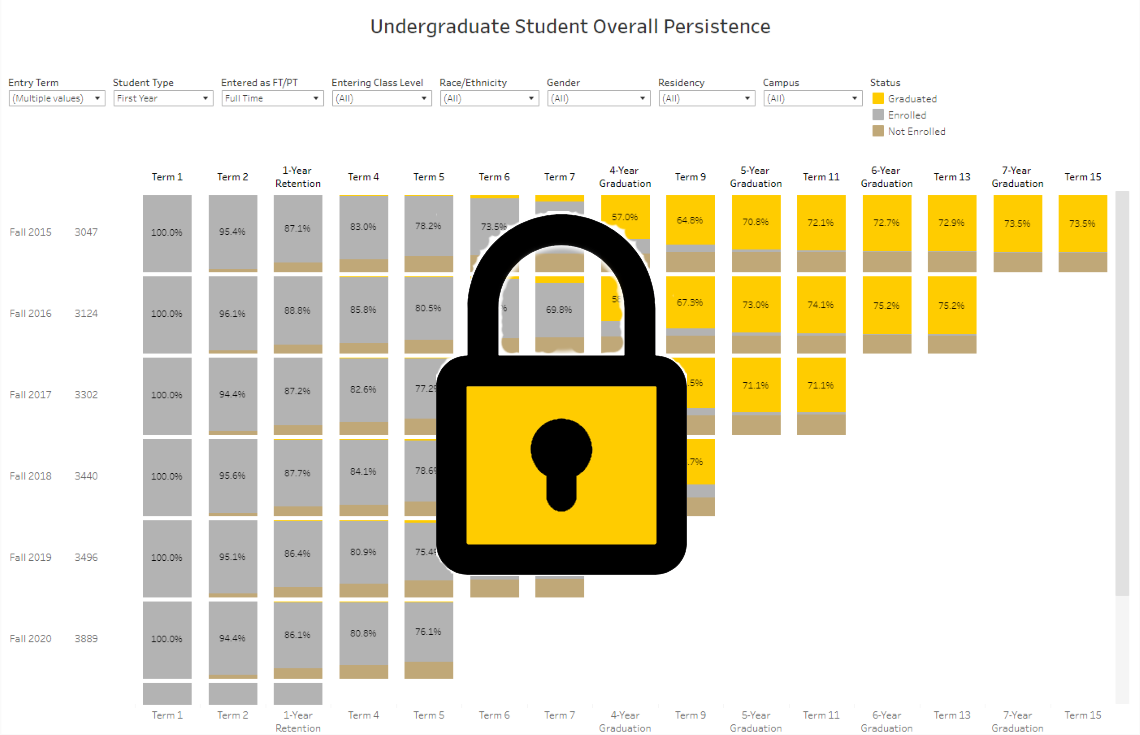
Student Performance and Persistence
This dashboard tracks student persistence by term and year based on term grades with year over year and term over term performance comparisons.
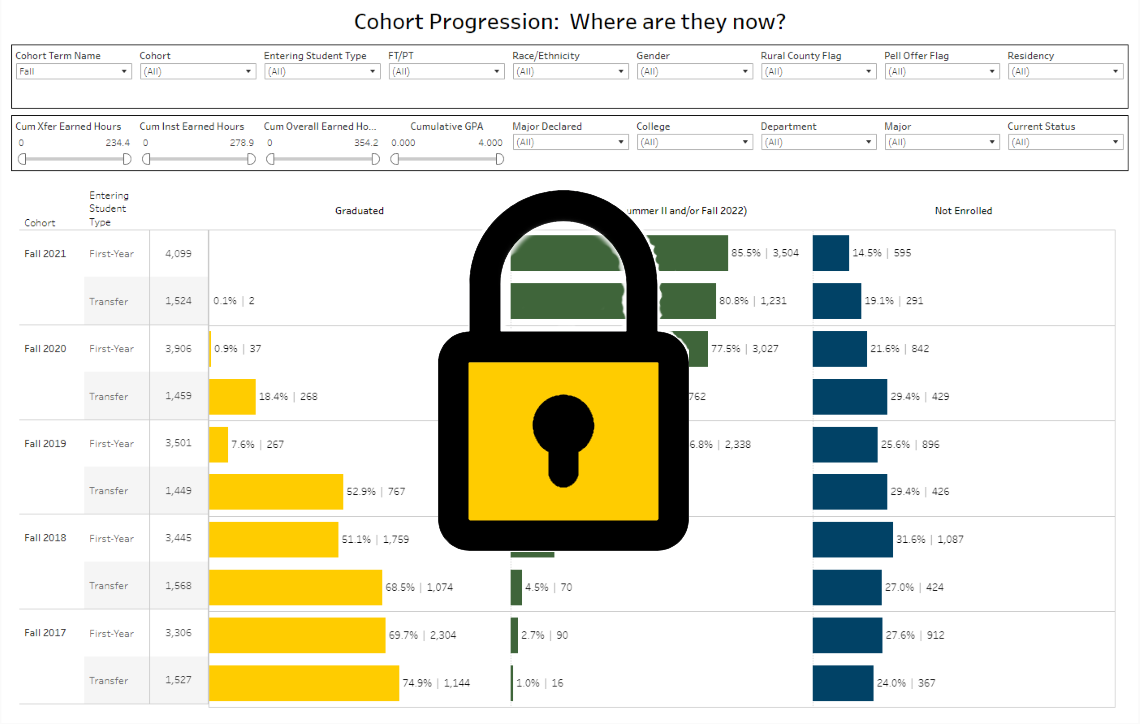
Undergraduate Cohort Progression
The Cohort Progression Dashboard looks at New First-Year and New Transfer students who started in the fall and spring semesters from fall 2017 to the present to determine their current status.
Undergraduate Persistence and Forward Migration by Entering Area
This dashboard details the persistence (retention and gradation) for entering new undergraduate students. It details the college, department, or program of students in their entry term and shows the number and percent subsequently earning a degree within that respective unit/program, and if not, the academic unit/program in which a student did earn a degree.
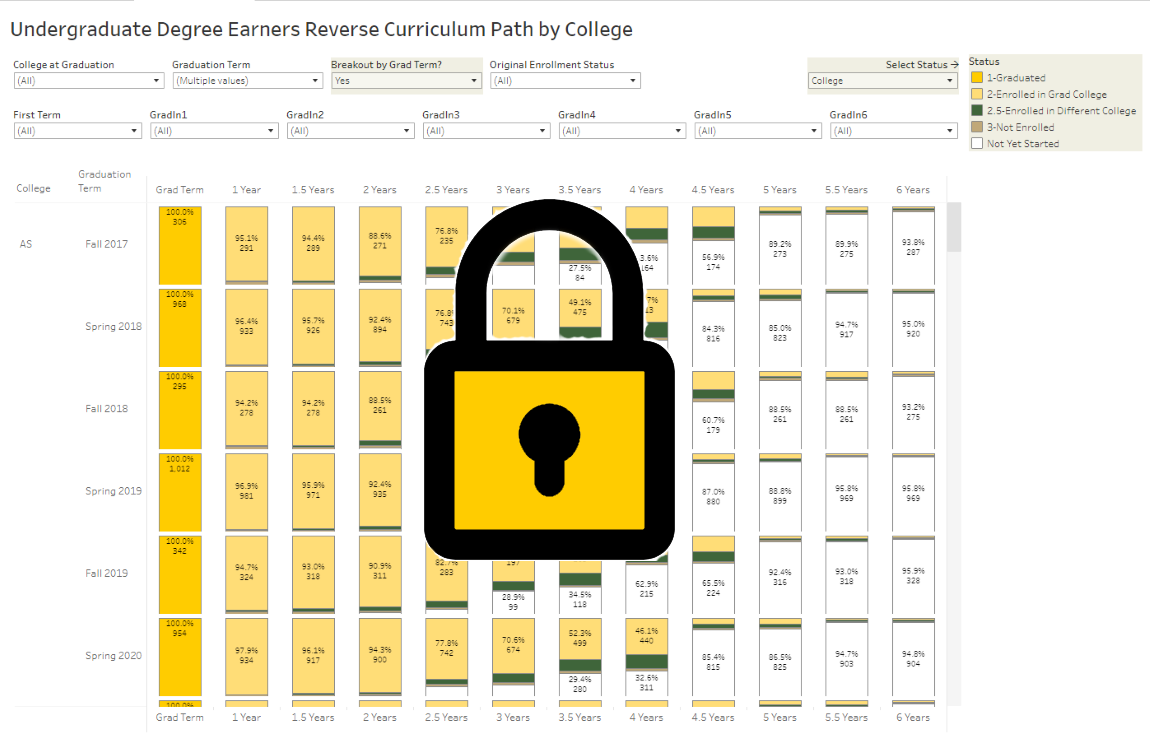
Undergraduate Degree-Earners Reverse Curriculum Path
This dashboard tracks undergraduate degree earners from graduation backward through their respective previous term enrollments by college, department and major. This dashboard shows the students' migration to the degree-earning academic area.
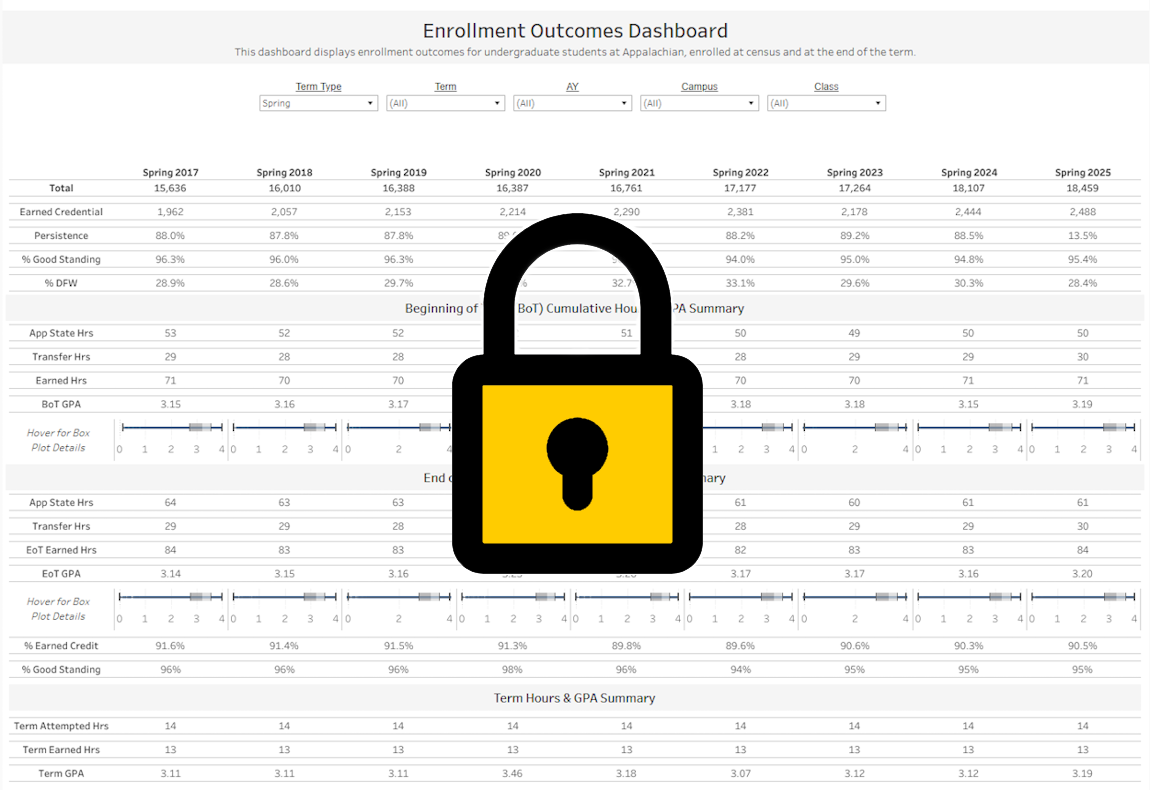
Enrollment Outcomes by Term
This dashboard shows the student academic outcomes by term, including both term and cumulative attempted hours, earned hours, term earned GPA, and cumulative earned GPA.
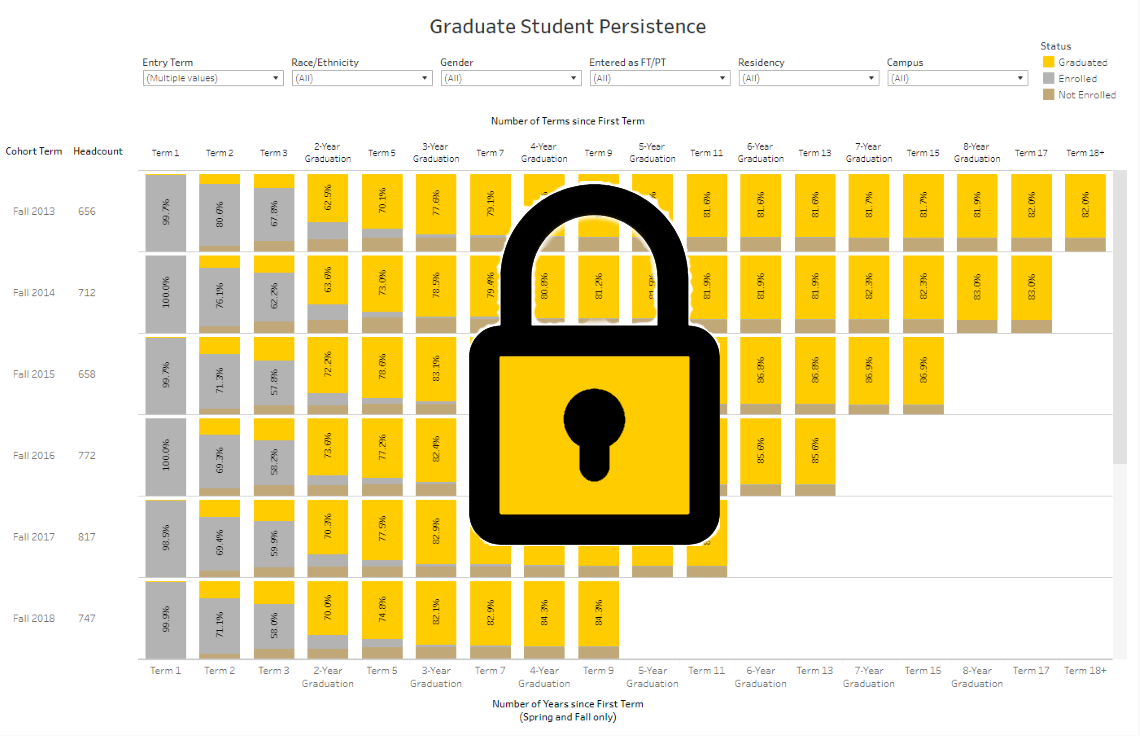
Graduate Student Persistence Overall and by Program
This dashboard details new graduate student persistence (retention and graduation) by their entering term and program (beginning on tab 3). This is a persistence and graduation rate by program and only includes students who persisted and/or graduated in the same program they began.
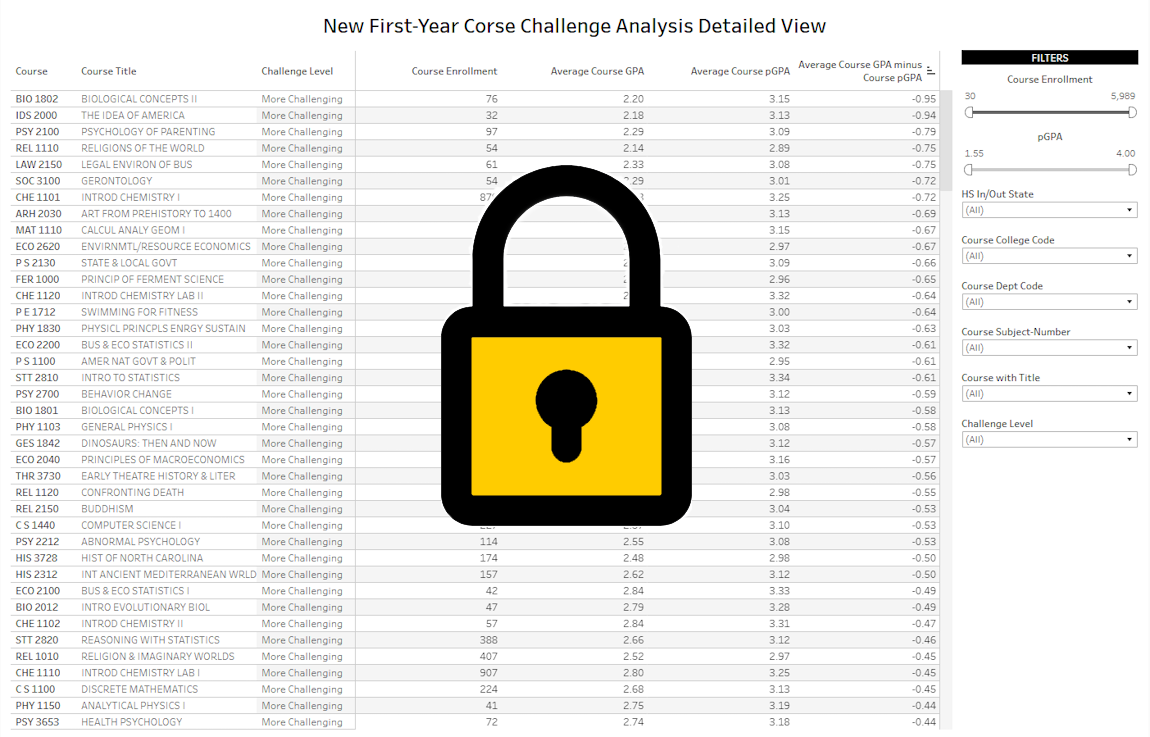
New First-Year Course Challenge Analysis
This dashboard compares average student pGPAs to average course GPAs in order to determine how challenging courses are for new first-year students.
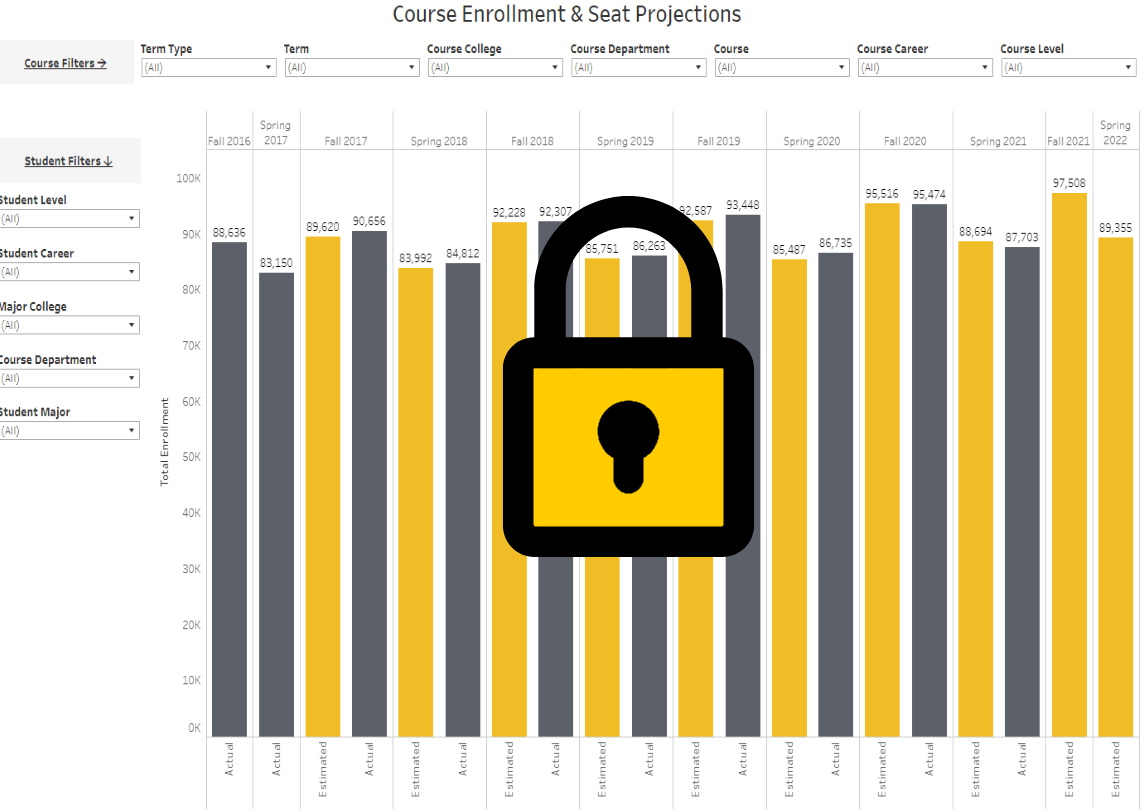
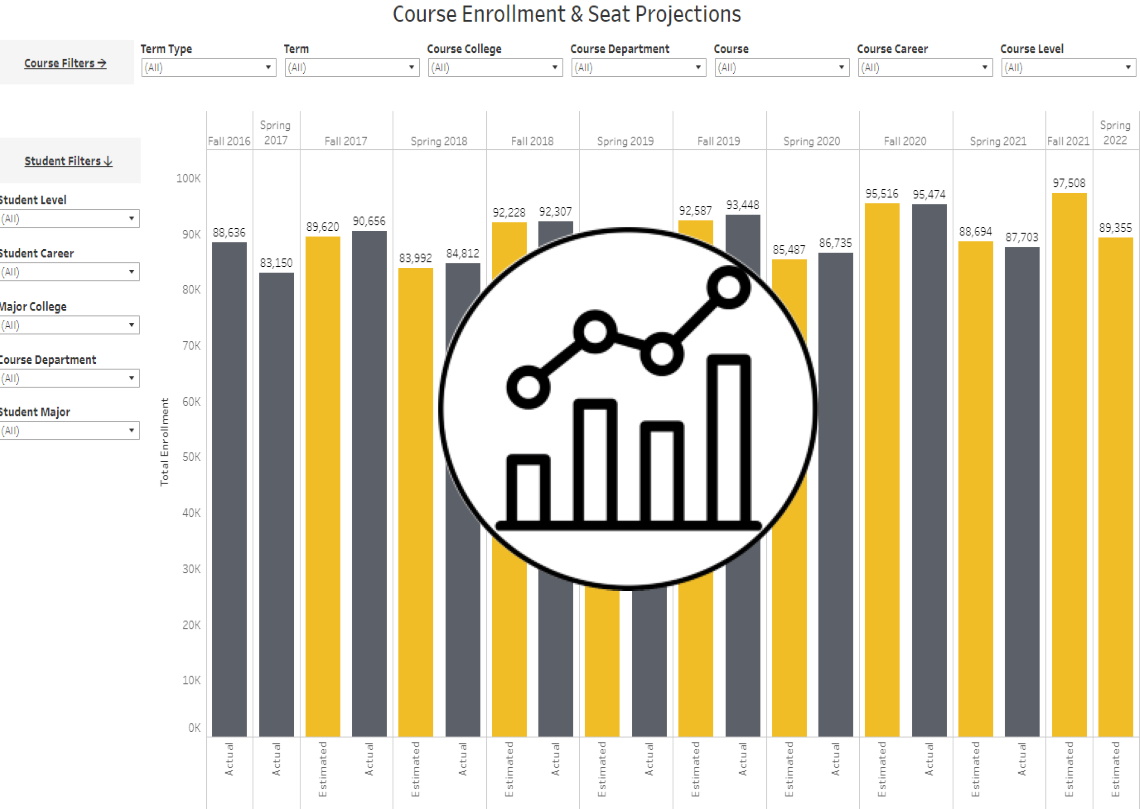
Course Seat Projections
Course seat projections for graduate and undergraduate, main campus and App State Online, projections by college, department and course.
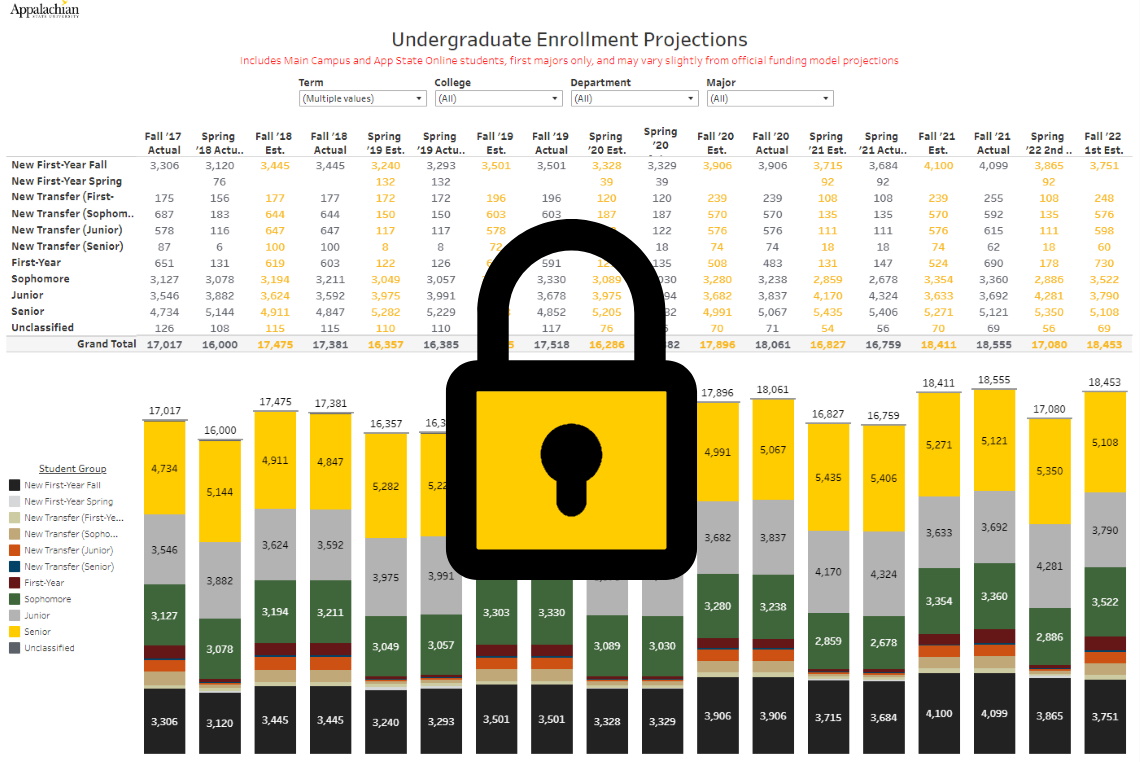
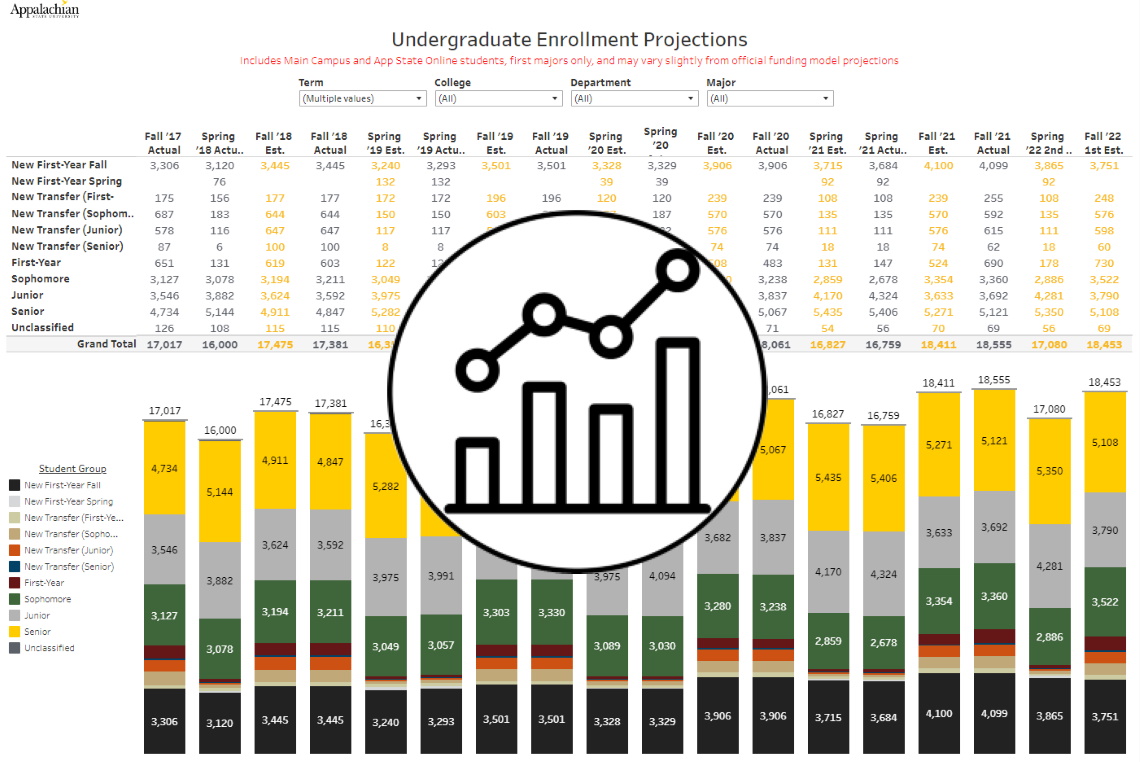
Undergraduate Enrollment Projections
Undergraduate enrollment projections include both main campus and App State Online students. The undergraduate enrollment projections are consistent with and used for determining the accompanying course seat projections.
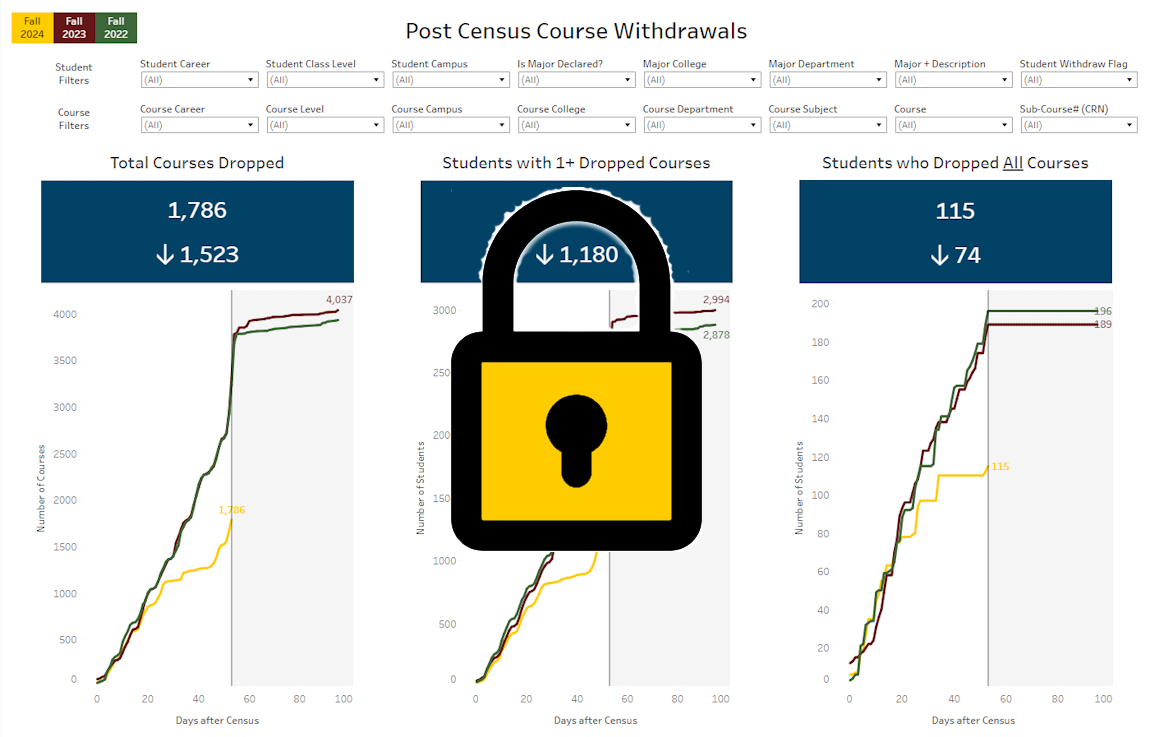
Post Census Course Withdrawals
This dashboard tracks daily course and student withdrawals after census.
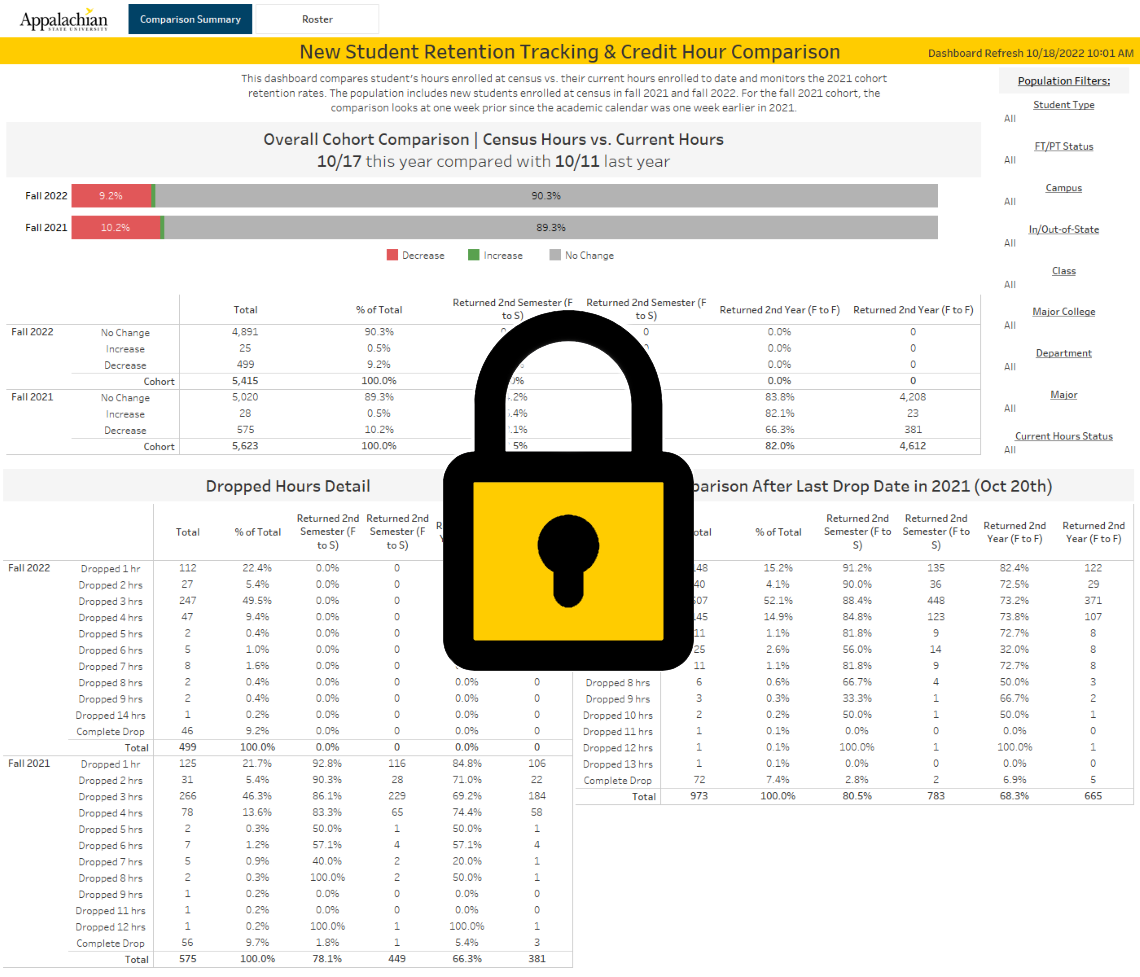
Retention Tracking & Credit Hour Comparison
A comparison of new undergraduate student credit hours at census vs. current credit hours enrolled to date. The dashboard also monitors cohort retention rates with indicators for current credit hour status and other enrollment details.
Undergraduate New Cohort Credit Benchmarks
Tracking entering new undergraduate cohorts reaching credit hour amounts (>=30 after year 1, >=60 after year 2, >=90 after year 3).
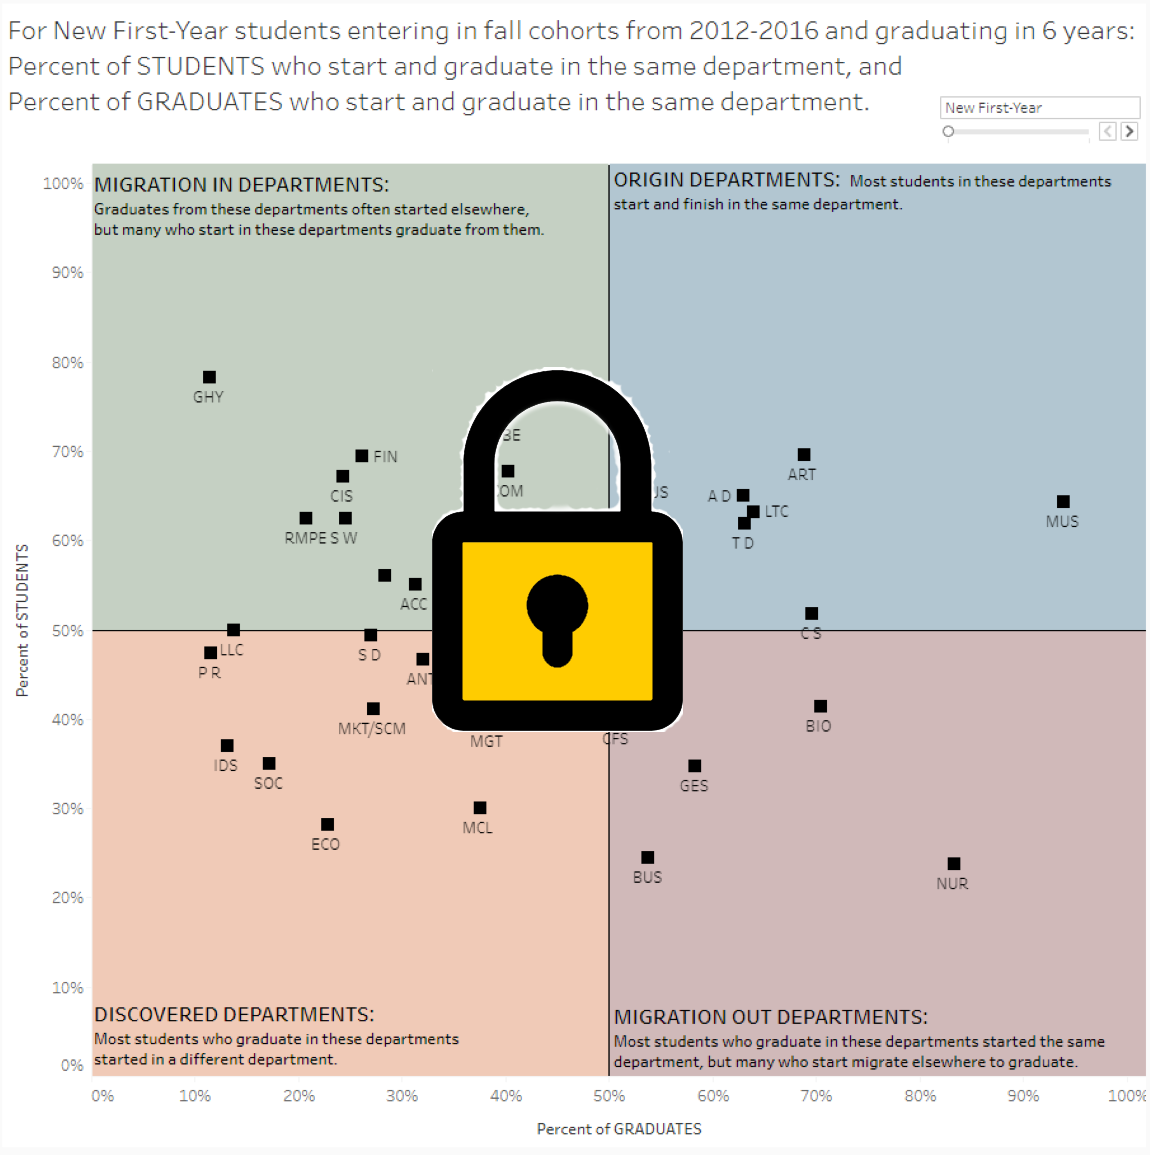
Department Quadrant Analysis of Undergraduate Degree-Earners - Entering and Final Department
This dashboard shows the percentage of new students earning a degree in their entering department and the percentage of this population for all degree-earners in the same department. This dashboard highlighted which departments have significant in/out-migration and those that do not.
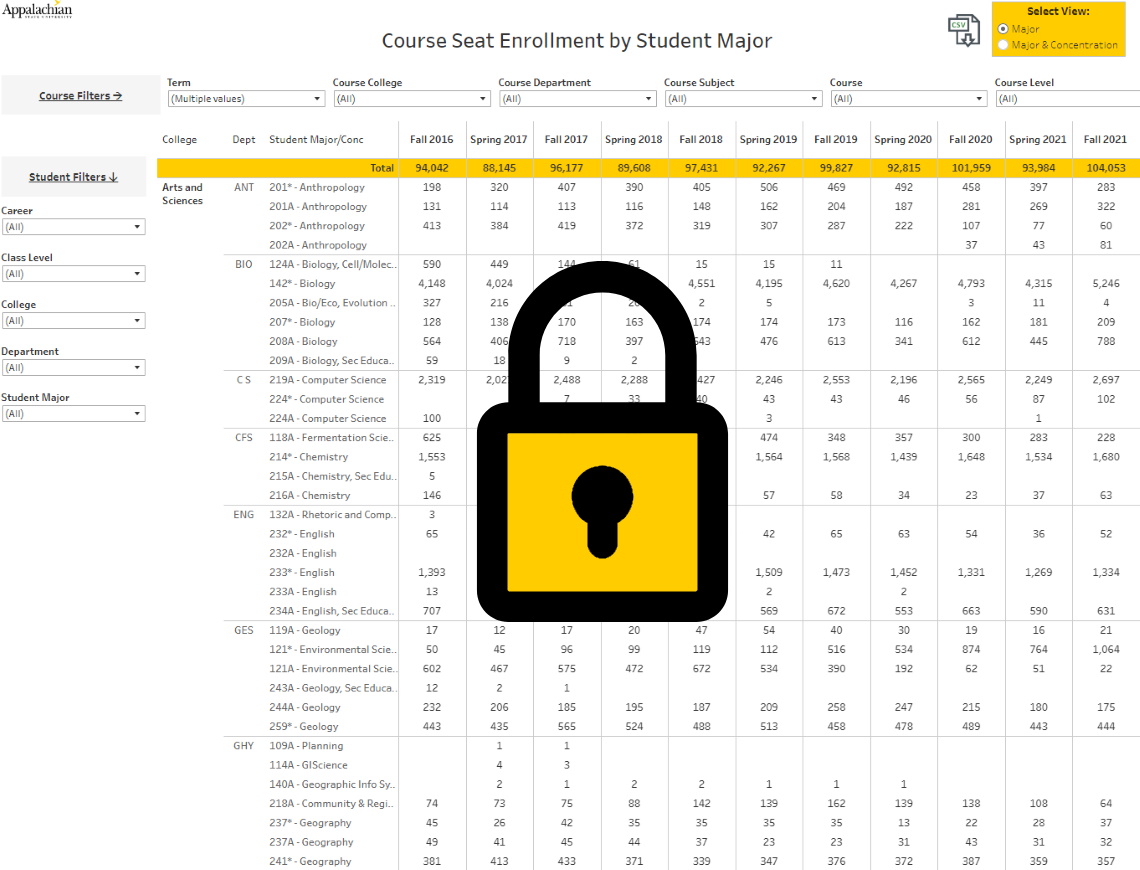
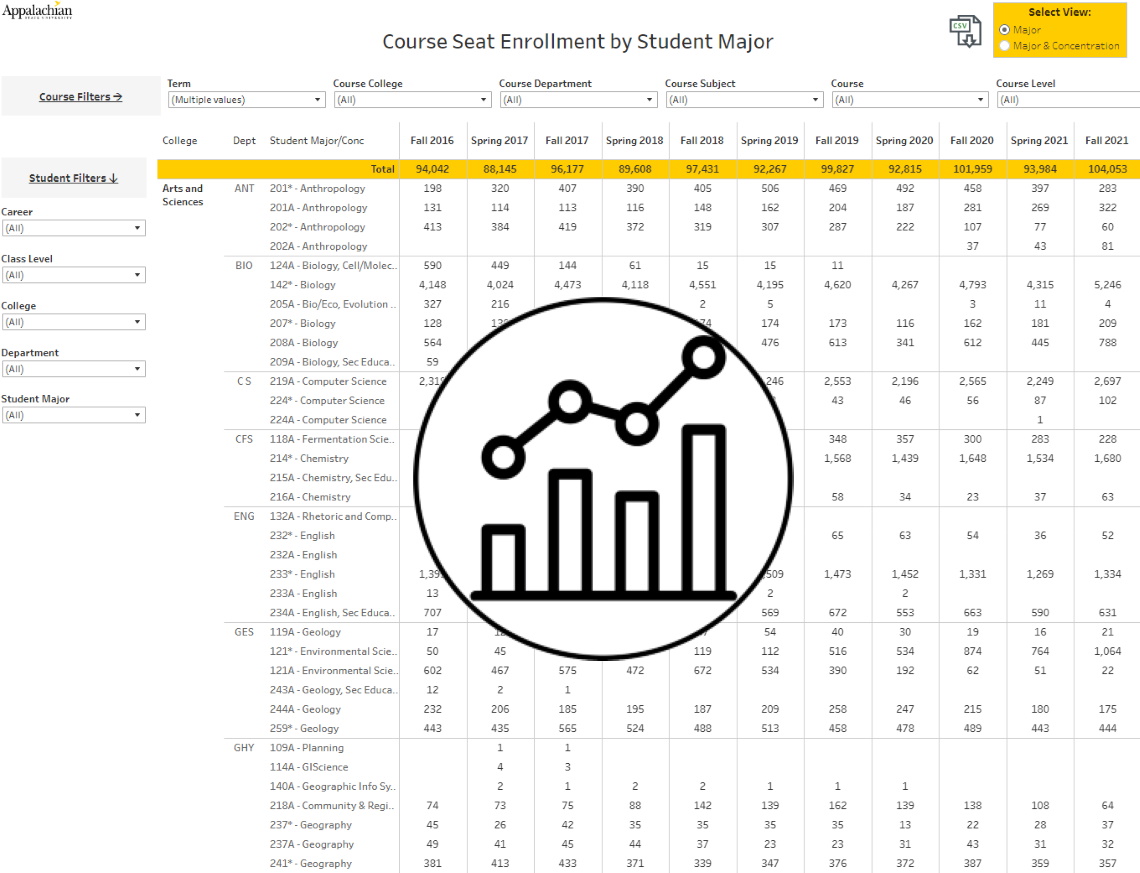
Course Seat Enrollment by Student Major
A detailed summary of course seat enrollment by student major & concentration. Filters include course related attributes as well as student attributes (career, class level, etc).
Graduating Senior Survey - Deans
Each semester, IRAP administers a graduating senior survey seeking graduate satisfaction in various areas of the University. Please contact us with any questions or special requests regarding the senior survey.
Graduating Senior Survey - Chairs
Each semester, IRAP administers a graduating senior survey seeking graduate satisfaction in various areas of the University. Please contact us with any questions or special requests regarding the senior survey.
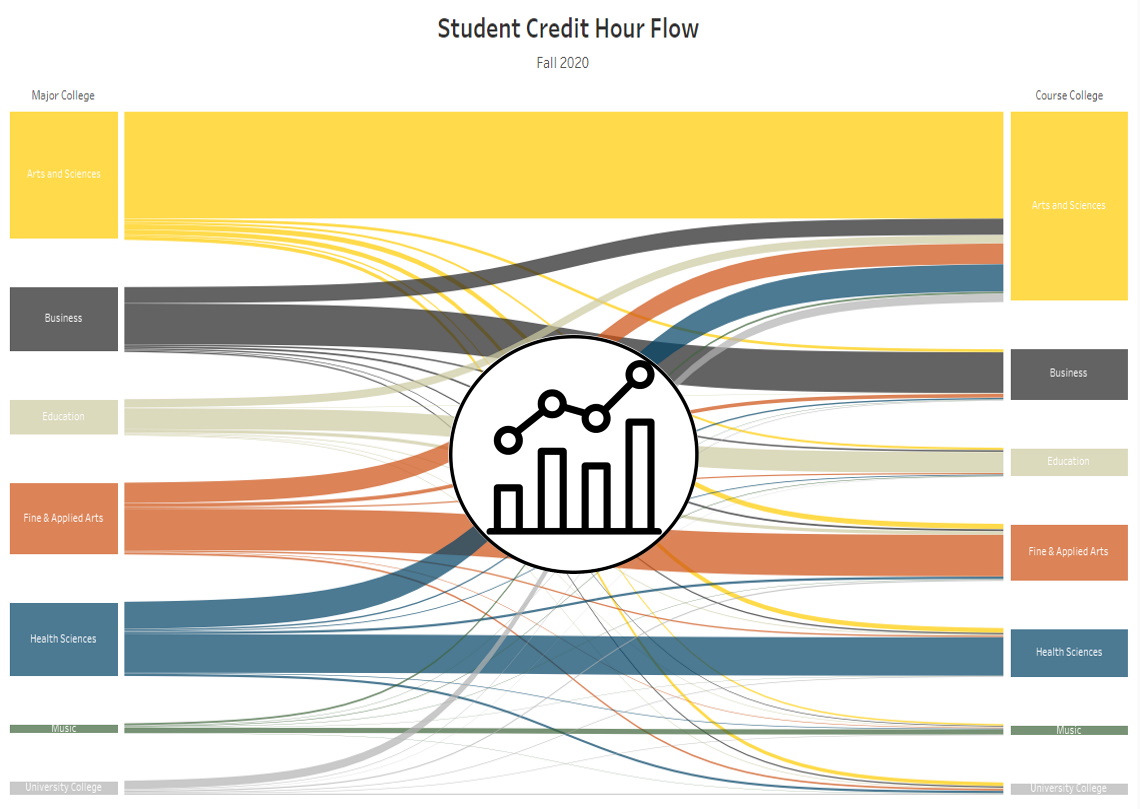
Student Credit Hour Flow
This dashboard highlights the credit hours generated by student major and course offering across the institution.
Need some help? Learn how to navigate and engage with AppAnalytics by viewing the quick reference guide. |